List of Web Components for Building an Analytics Dashboard

Dashboard is an effective way to visualize data due to their clarity, conciseness, and user-friendly interface. They are widely used to track key performance indicators (KPIs), analyze trends, and help to gain compelling insights and make informed decisions. There are many ways how to create dashboards; there are full-blown dashboard solutions as well as different javascript libraries, with the help of which you can add any needed component you wish, such as pivot, charts, scheduler, etc.
JavaScript libraries are an excellent choice for building dashboards because they are lightweight, flexible, and cost-effective. Coding your own dashboard allows you to completely customize the appearance, use any visualization you want, and do more extensive data processing, but it also requires a certain level of technical expertise.
Read more on Javascript in the blog Top 21 Best JavaScript Frameworks to Use in 2023
This article will explore a list of web components that can help you build a dashboard for your web application. We will also discuss some additional benefits of using JavaScript libraries for dashboard development.
Libraries vs. Custom BI Solutions: Which is Right for Your Analytical Project?
When choosing between a JavaScript library and a custom BI solution for your analytical project, consider the following factors:
- Complexity and scale: Custom BI solutions are typically better suited for complex and large-scale projects, where there is a need for a wide range of features and customization options. JavaScript libraries, on the other hand, are a good choice for less complex projects or for adding dashboards to existing web applications.
- Budget: Custom BI solutions can be expensive, especially for enterprise-level businesses.
- Expertise: Custom BI solutions require specialized knowledge and expertise to set up and configure. JavaScript libraries are typically easier to use, even for developers with limited experience in data visualization.
JavaScript libraries can be a great way to build dashboards for your web application. They offer several advantages:
- Speed and agility: JavaScript libraries are typically smaller and lightweight, resulting in quicker loading and rendering of dashboards. This is particularly advantageous for dashboards accessed frequently or by a large user base.
- Customization: Ready-made dashboards are typically designed for general use and may only be able to meet some of your specific needs. Javascript libraries allow you to create custom dashboards that are tailored to the specific needs of your organization. When you build your own dashboard, you can customize it to include the data and visualizations that are most important to you and to arrange them in a way that makes sense for your workflow.
- Flexibility: JavaScript library can create dashboards tailored to specific user roles or departments within your organization. This versatility allows you to meet the diverse needs of different users.
- Cost savings: JavaScript libraries are usually more cost-effective, saving your business money on software licensing and maintenance expenses.
Overall, JavaScript libraries are a good choice for building dashboards for most businesses. So, I’ve compiled a list of the top dashboard libraries that I use regularly. It’s not exhaustive, but I find them to be effective and powerful. There are both free and commercial options available, so you can choose the best fit for your product and use case
Calendar and schedule
Calendar and scheduler web components allow you to create interactive calendars and schedulers in web applications. They typically offer features such as date and time selection, event creation and editing, and drag-and-drop scheduling.
jsCalendar
jsCalendar is a pure JavaScript library that helps you create customizable inline calendars on any web page. It is JSON-based and has a number of advantages over other calendar formats, such as being more human-readable, flexible, and extensible.
It is supported by many calendar applications and services, and it is a good choice for anyone who needs to create a calendar that meets their specific needs. It features a simple interface, rich documentation, multi-language support, and multiple theme options.

Licensing: MIT
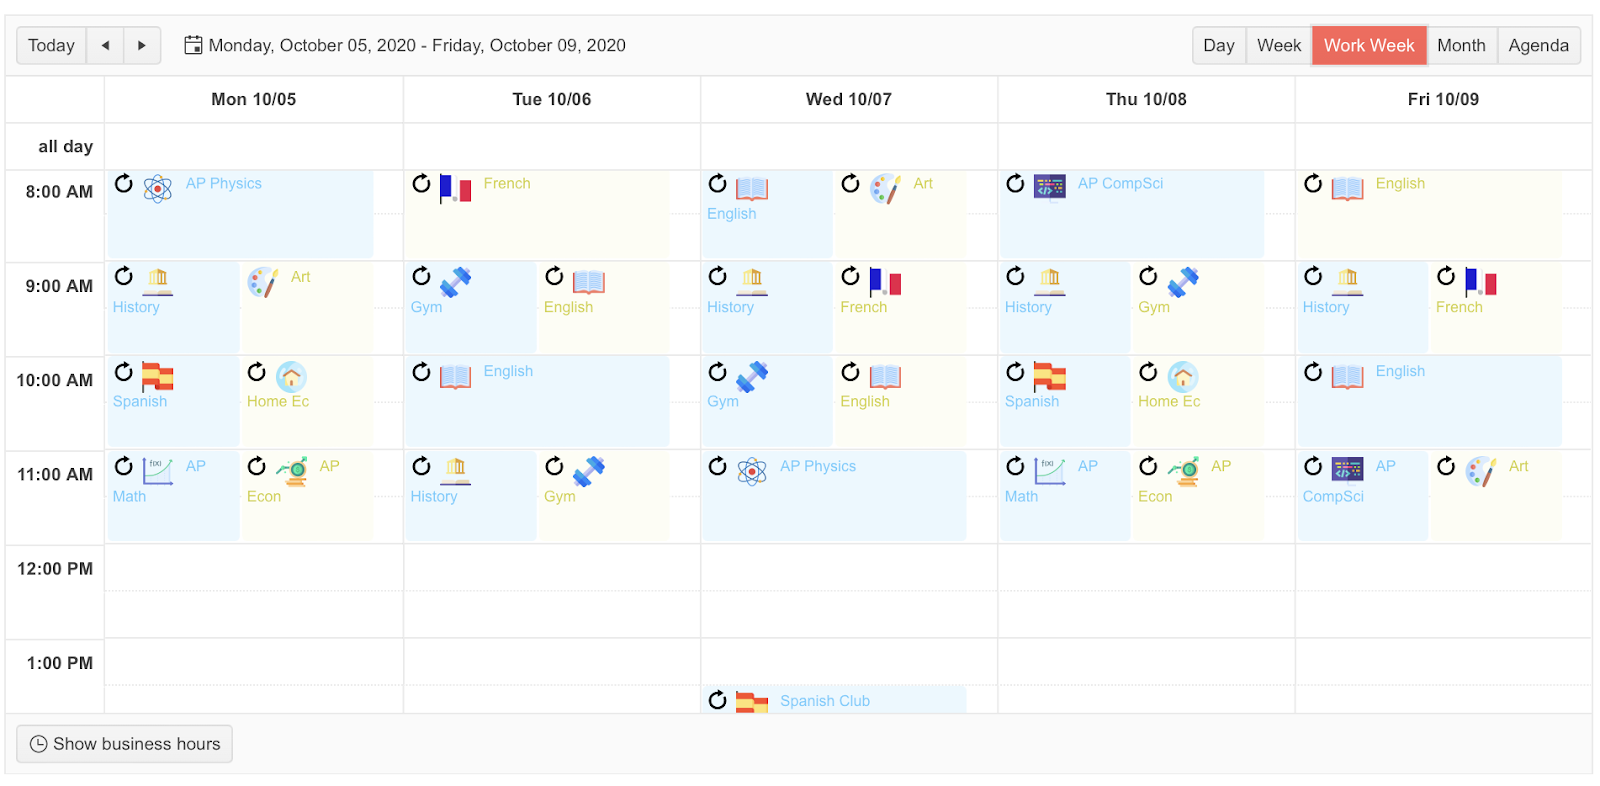
Kendo UI scheduler
Kendo UI Scheduler is a powerful and flexible JavaScript library for creating and managing calendars. It supports displaying scheduled events in different views, such as single days, whole weeks, or months, or as a list of tasks that need to be accomplished. The scheduler provides many features: data binding, views, resources, time zones, printing, adaptive rendering, and more. The Scheduler events can use data from both your device and an external source. You can also implement a custom view. The scheduler supports resources that can be assigned to an event.
Licensing: starting at 999$
Bryntum Scheduler pro
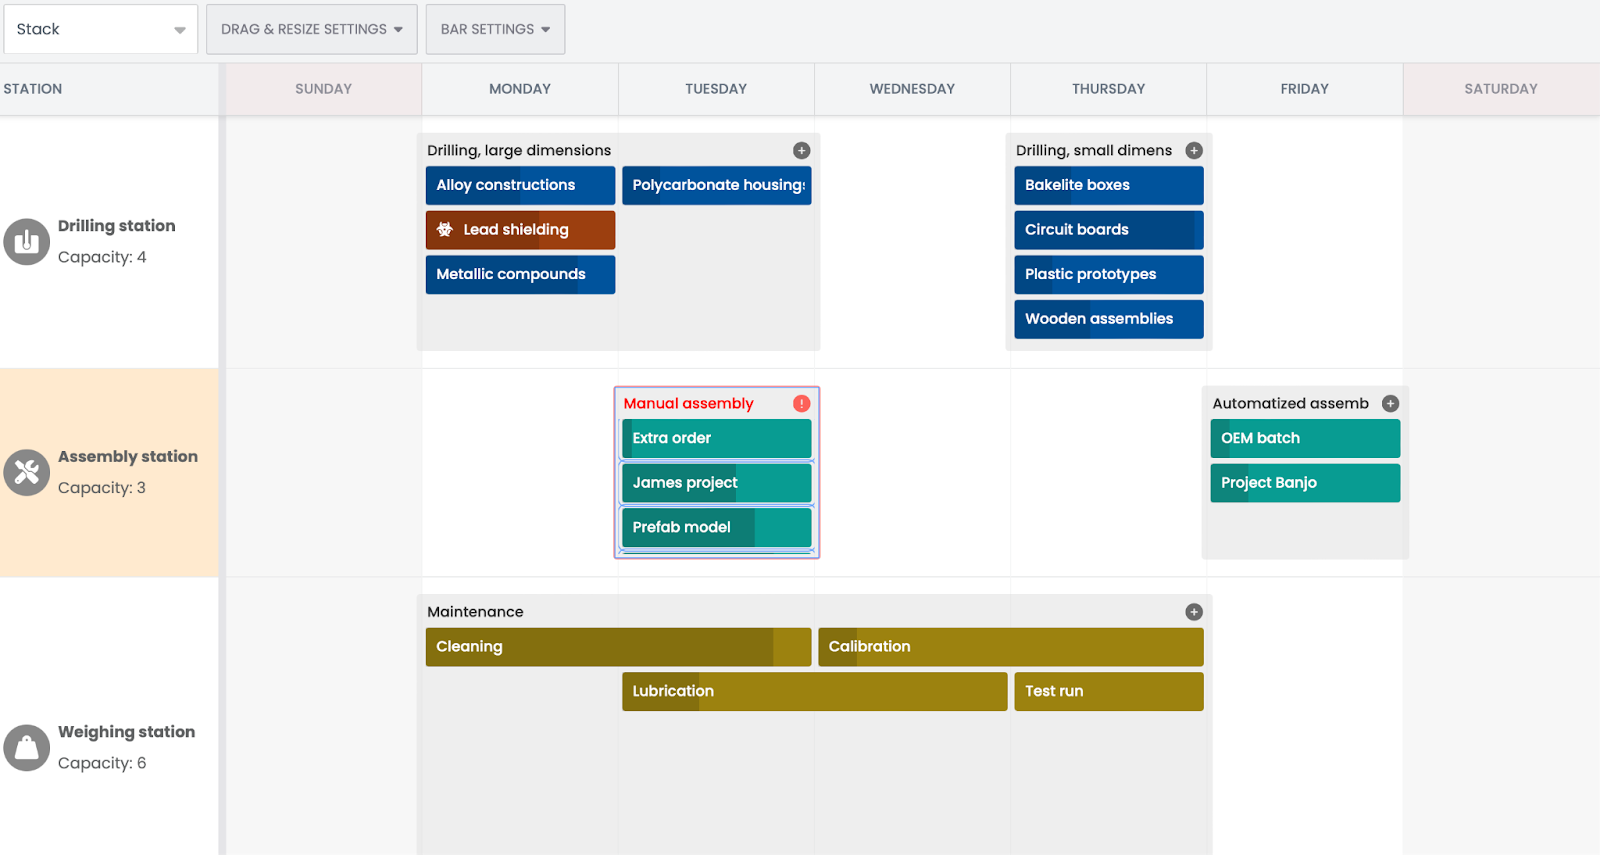
Bryntum Scheduler Pro is a JavaScript library for creating and managing advanced scheduling applications. This library includes a wide range of features, such as the ability to schedule resources, create Gantt charts, resolve conflicts, collaborate with others, and integrate with other popular JavaScript frameworks, such as React, Angular, and Vue.js.
Bryntum Scheduler Pro provides a comprehensive API and a variety of examples and tutorials to help you get started quickly.
Licensing: starting at $1100
Pivot Table
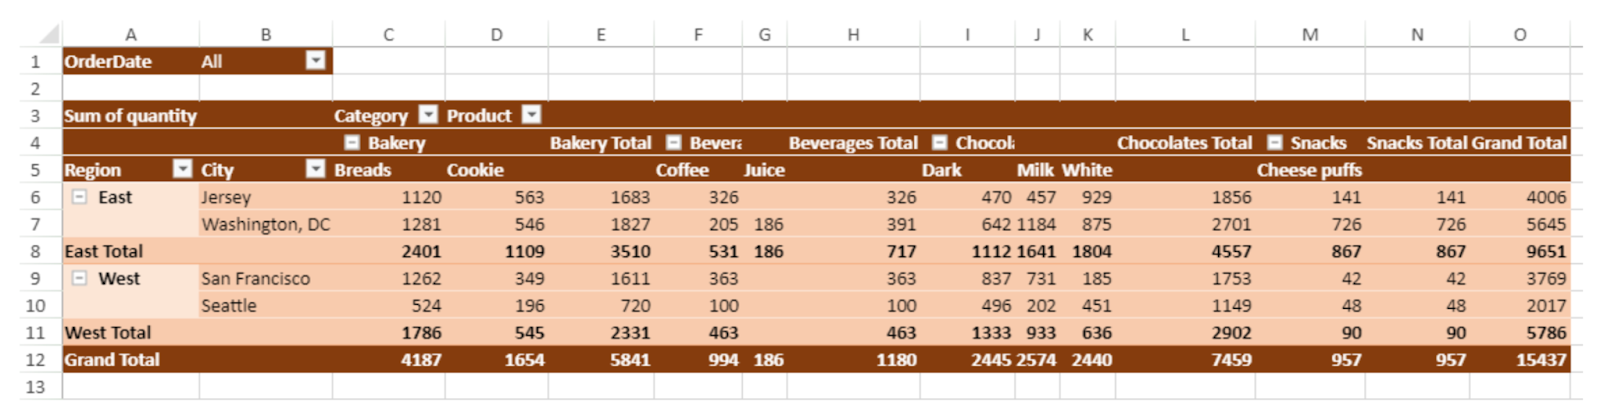
Pivot table web components allow you to create interactive tables that summarize and analyze data in a variety of ways and can help understand complex data. They typically offer features such as drag-and-drop field placement, aggregation functions, and data filtering and sorting.
WebDataRocks Pivot
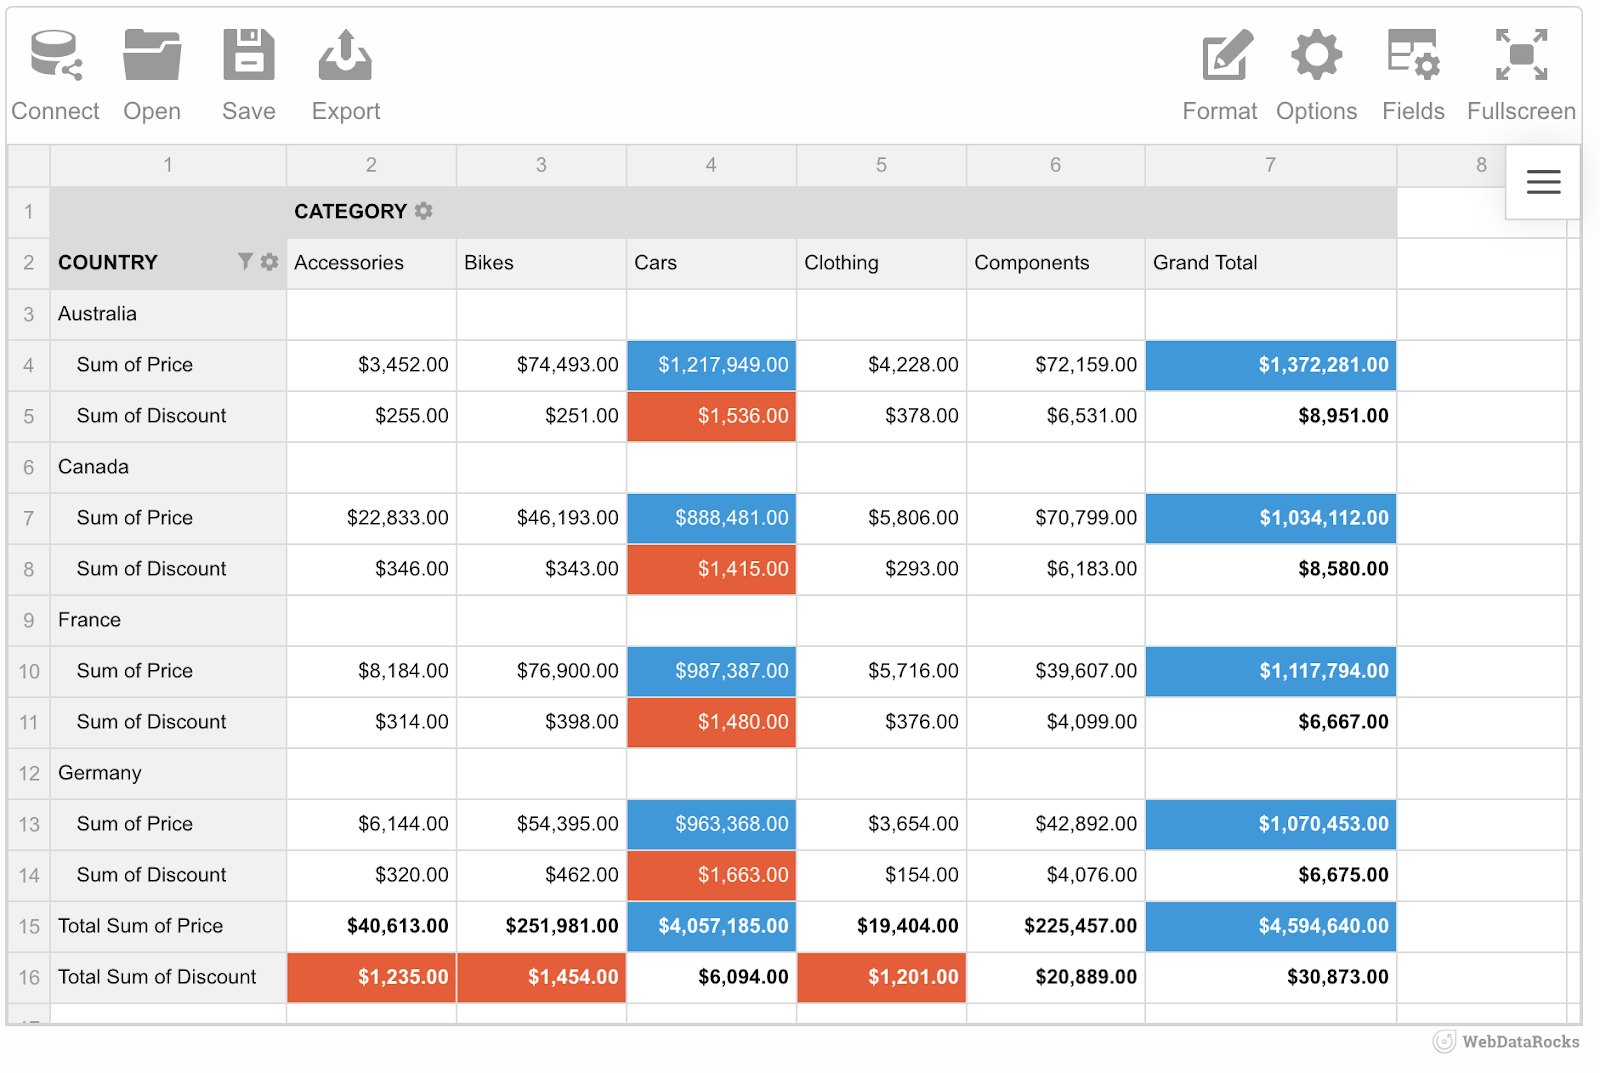
WebDataRocks is a free JavaScript data analysis and visualization reporting component. It is easy to use and offers a wide range of features, such as support for different data types, drag-and-drop field placement, aggregation functions, data filtering and sorting, grand totals and subtotals, exporting data to different formats, and integration with other popular JavaScript frameworks and libraries. Compared to other free pivot grids, WebDataRocks is an easy to implement tool with an intuitive UI and good customization options. It works perfectly without any enhancement; which saves you a lot of time.
Licensing: Free, based on custom terms
Also Read:
Types and Examples of NoSQL Databases
Why NoSQL is the future of IoT
Adapting NoSQL Syntax to SQL Databases
MongoDB, Cassandra, and HBase-the three NoSQL databases to watch
5 Questions Enterprises Should Ask When Selecting a NoSQL Database
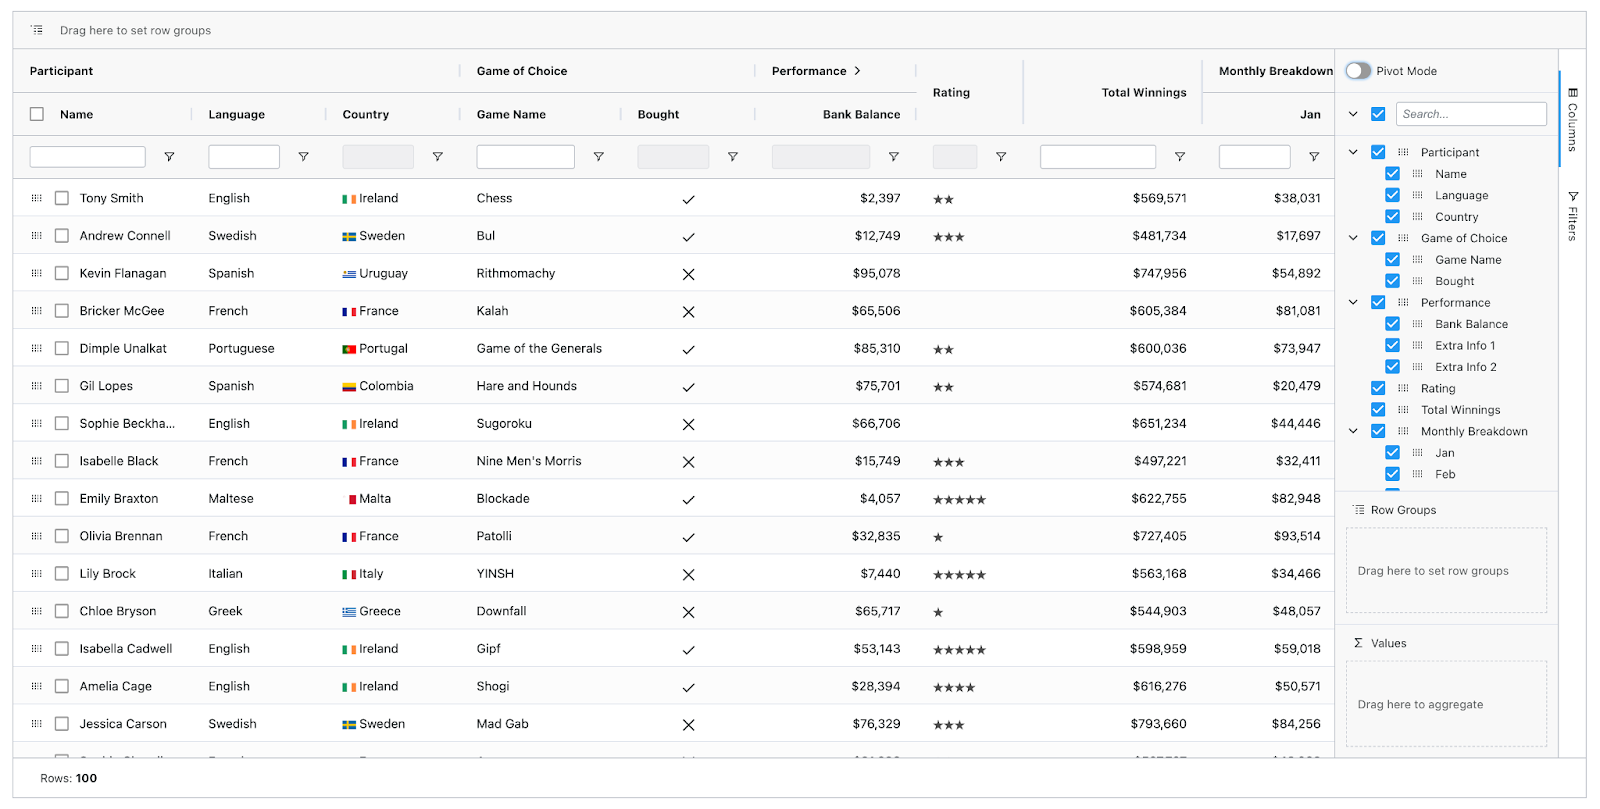
Flexmonster Pivot Table
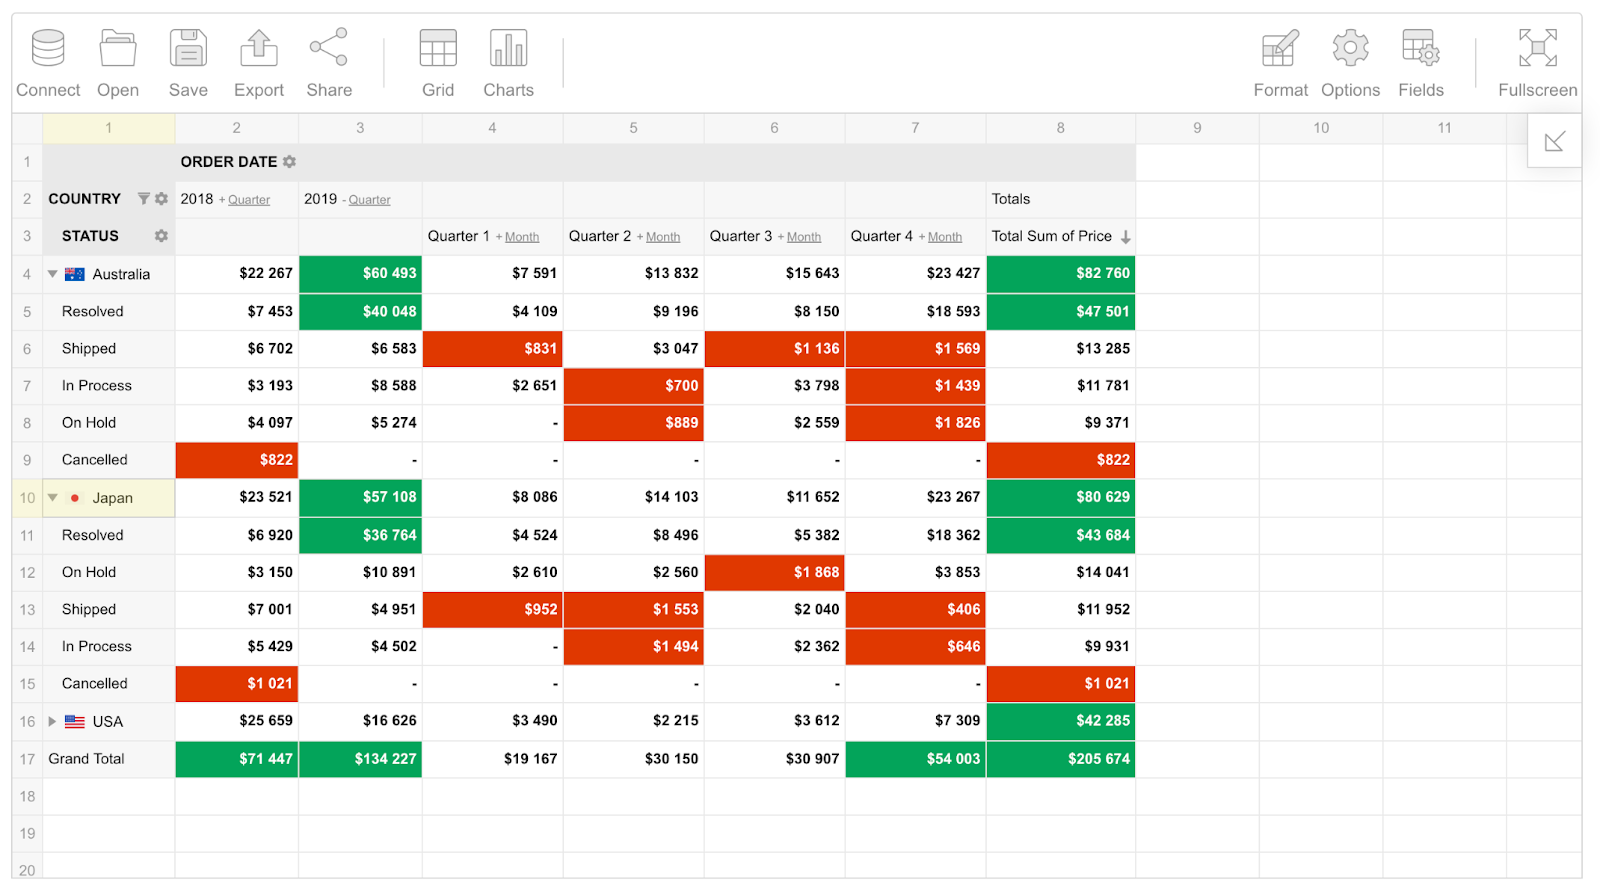
Flexmonster Pivot Table & Charts is a JavaScript library for visualization and analysis of complex data on the web. It has an extended API and a flexible configuration, which makes it an ideal component for creating dashboards.
Flexmonster pivot grid supports various data sources, including CSV, JSON, SQL & NoSQL databases, MongoDB, ElasticSearch, and OLAP cubes. You can aggregate, group, filter, sort the data, and compose your report right through the UI and then save it or export it to different formats.
The component also offers a variety of customization options, allowing you to change the appearance, and behavior of the component, arrange it to your business logic, and add custom calculations and filters.
One of the great features of Flexmonster is its embedded pivot charts. This means that users can easily add charts to their dashboards without using a separate charting library. This makes it easier to build and maintain interactive dashboards.
Licensing: starting at $799 / year
Has a free 30-day trial
SpreadJS Pivot Table
SpreadJS Pivot Table is a JavaScript library for creating and managing pivot tables. This tool has a simple interface and many capabilities, such as handling various kinds of data, arranging fields by dragging and dropping, performing calculations, filtering, and sorting data.
Licensing: $1499/developer
Charts
Chart web components provide data visualization in various ways, such as line charts, bar charts, pie charts, and scatter charts. They typically offer features such as zooming, panning, and data labeling. Some chart web components even offer unique chart types such as treemaps, sankeys, heatmaps, and bubbles.
Charts make data visualization more attractive and engaging.
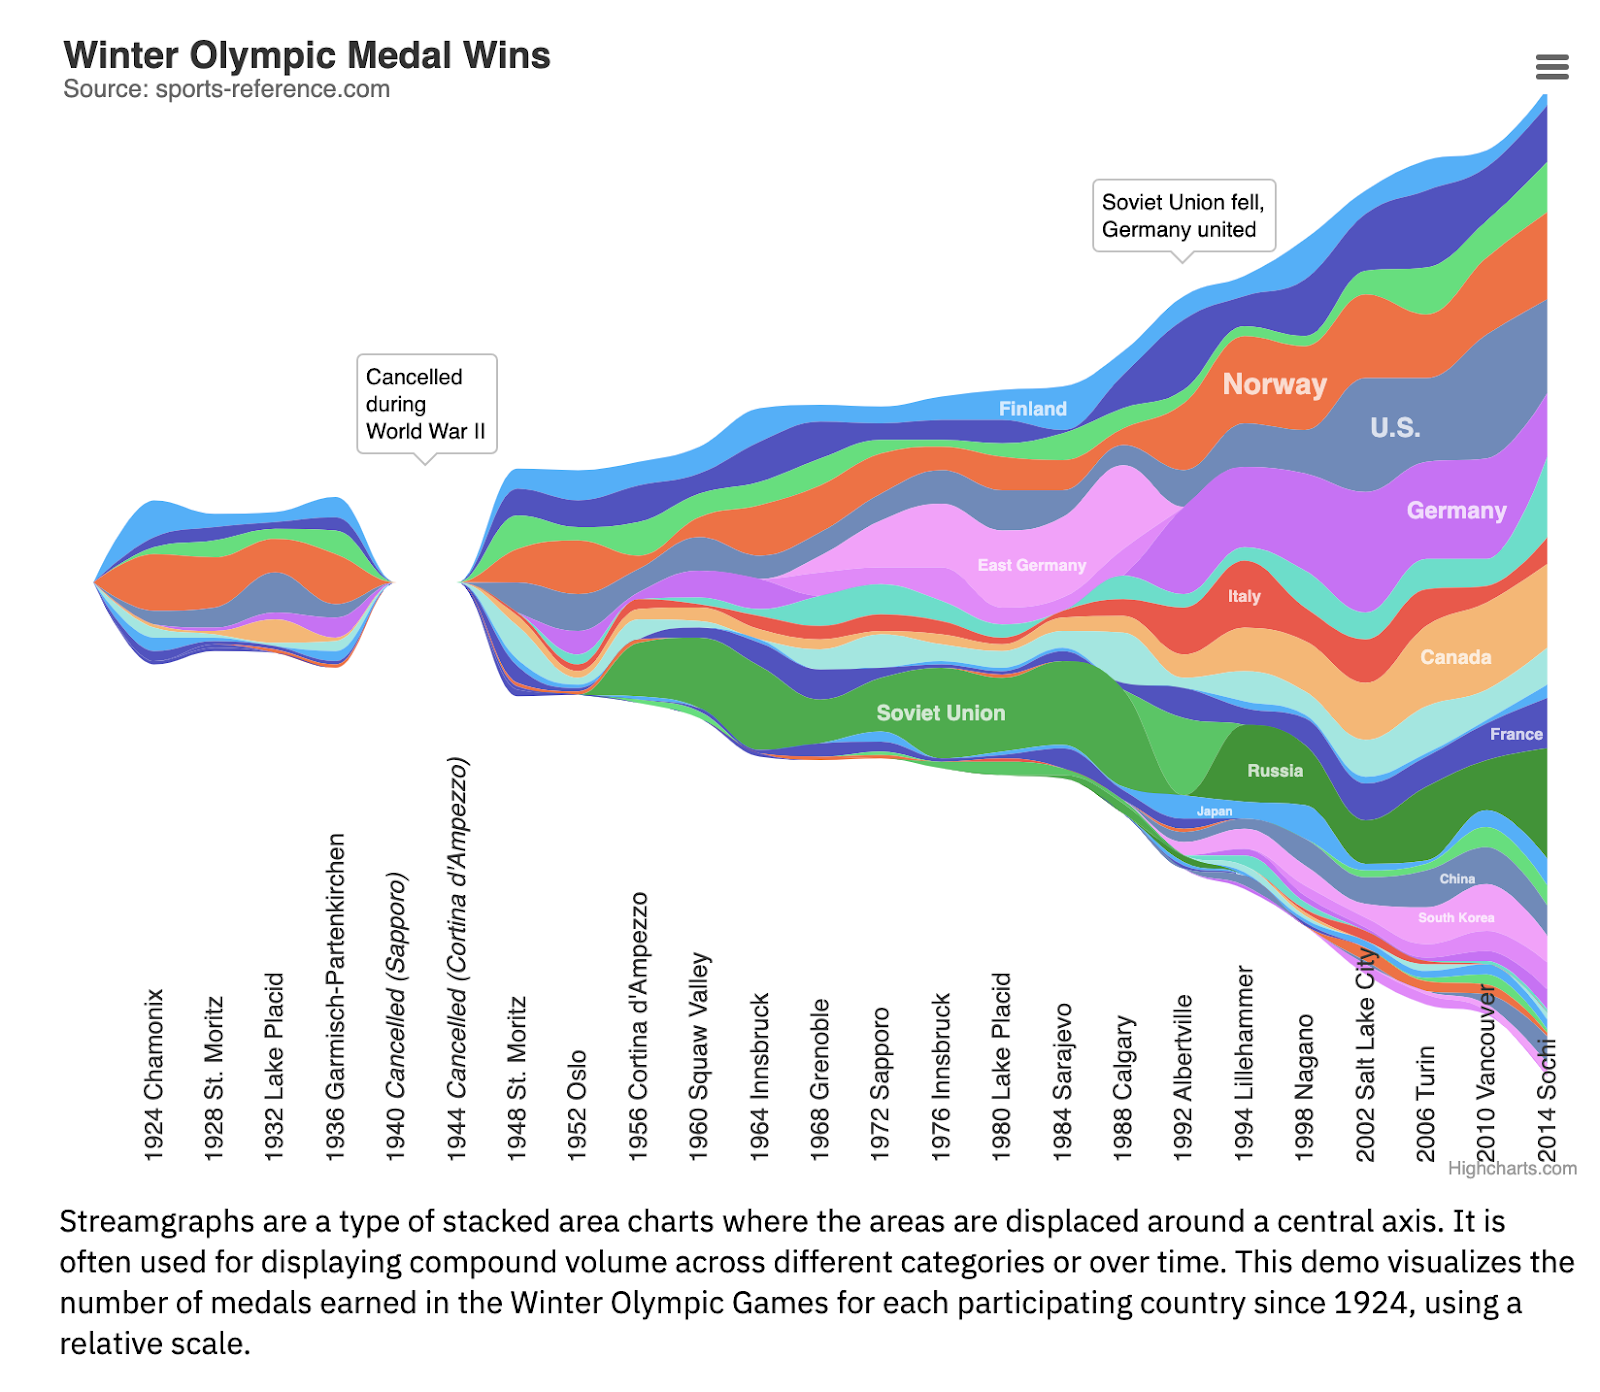
HighCharts
Highcharts is a JavaScript library that makes it easy to create charts that are interactive, responsive, and accessible on both web and mobile devices.
Highcharts supports a wide variety of chart types, including line charts, area charts, bar charts, pie charts, column charts, and scatter charts. It also has some specialized chart types, such as heatmaps, treemaps, and waterfall charts.
Highcharts charts are created using SVG, which makes them scalable and responsive.
Licensing: starting at $160/Year
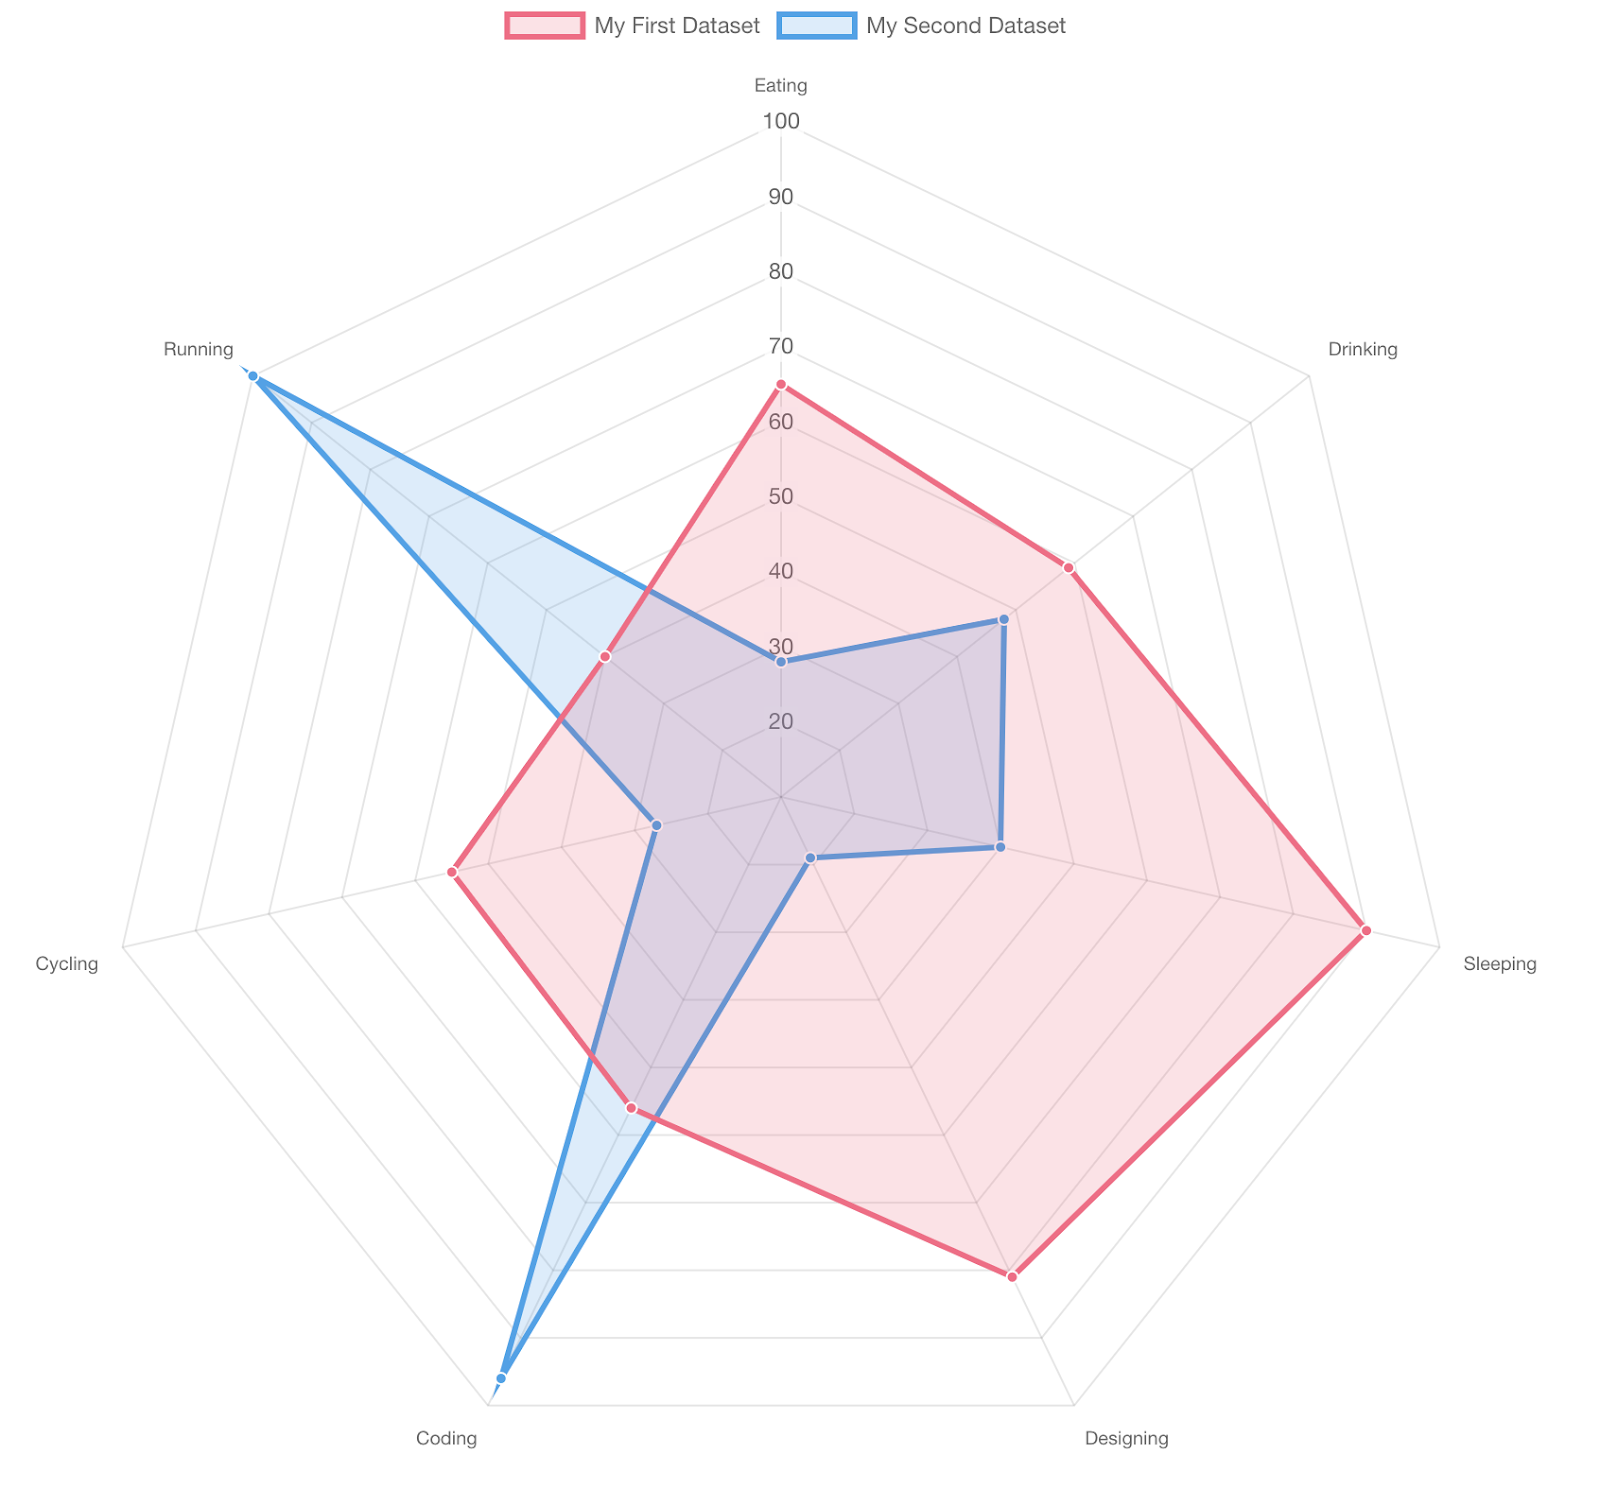
Chart.js
Chart.js is a free and open-source JavaScript library for creating interactive charts. It is a very popular charting library used by many businesses and organizations to create dashboards and other data visualization applications that match specific needs.
Chart.js is easy to use and configure, and it offers a wide range of chart types, including line charts, bar charts, pie charts, scatter charts, and more.
Licensing: MIT
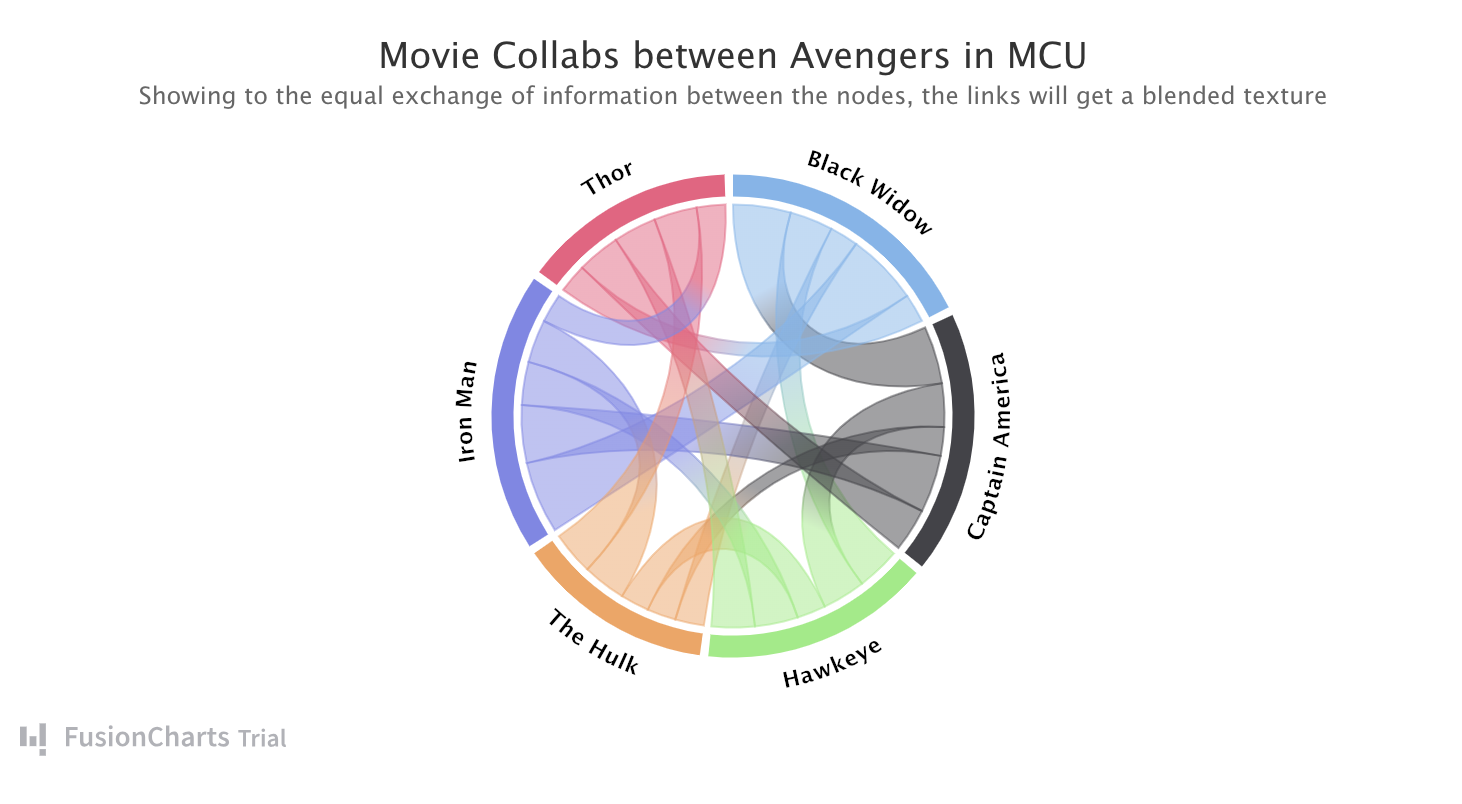
Fusion charts
FusionCharts is a JavaScript charting library that offers a wide range of features for creating interactive and data-rich visualizations. It is one of the most popular charting libraries available and is used by a wide range of businesses and organizations to create dashboards, reports, and other data visualization applications.
FusionCharts supports over 100 chart types, including line charts, bar charts, pie charts, scatter charts, and more. It also integrates with a variety of popular JavaScript frameworks and libraries, such as Angular, React, and Vue.js.
Licensing: starting at $439/Year
Also Read:
Top 50 Big Data Analytics Tools and Software You should know in 2024
The Importance of Big Data Analytics in Business
How to Use Big Data Analytics to Steer Your Business in the Right Direction
The Interesting Evolution Of Big Data Analytics
Big Data Analytics: A Weapon Against Rising Cyber Security Attacks
Top 5 Interesting Big Data Applications in Education
Data grid
Data grid web components allow you to display and manage large amounts of data in a tabular format. They typically offer sorting, filtering, grouping, and data editing features.
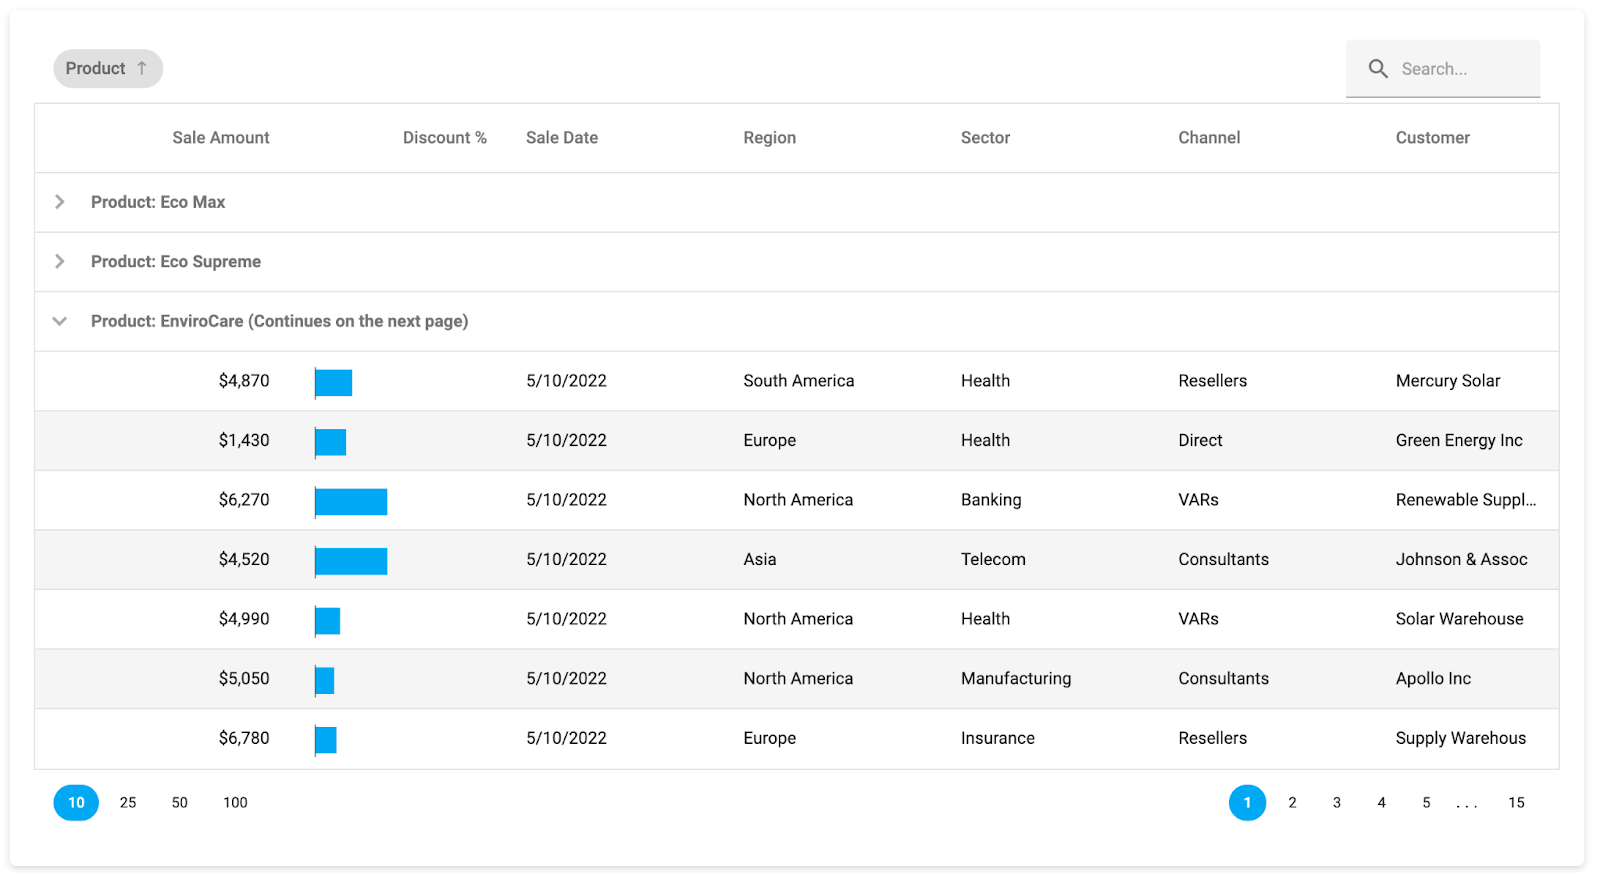
FlexGrid
FlexGrid is a powerful and flexible JavaScript library for creating and managing data grids. It offers a broad selection of features, including support for different data types, sorting, filtering, grouping, data editing, and export. FlexGrid is also highly performant and scalable, making it a good choice for large and complex datasets. FlexGrid is easy to use and configure, and it offers a comprehensive API and documentation.
Licensing: MIT
Ag-Grid
AG Grid is a feature-rich data grid designed for the major JavaScript frameworks. This component of user interface components is designed for professional use, and it provides a powerful and flexible way to show and manage events, appointments, or tasks. The library is available for React, Angular, Vue, and SolidJS 1.
AG Grid provides many features, such as data binding, views, resources, time zones, printing, adaptive rendering, and more. You can configure both local and remote data for the grid events. You can also implement a custom view.
Licensing: MIT for non-commercial usage (without pivot option)
A commercial license starts at $750
DevExtreme
DevExtreme Data Grid is a JavaScript library for creating and managing data grids. This library supports a variety of data types and allows users to sort, filter, group, edit, and export data. DevExtreme Data Grid is also highly performant and scalable, making it a good choice for large and complex datasets.
Licensing: Non-Commercial, Non-Competitive EULA
A commercial license starts at $499
Takeaways
Building your own dashboards is a rewarding experience, though it can be challenging at times. You can tailor a report to your specific audience and meet their needs, use your branding and design elements for a consistent look and feel, have more control over the data, and build more interactive and engaging dashboards for users.
A suitable JavaScript library can make creating dashboards more straightforward. By providing a variety of pre-built components and features, JavaScript libraries can help you save time and effort and create more visually appealing and user-friendly dashboards.
We hope this article has helped you learn more about the different components available for creating dashboards.
Related Posts

Building an AI-Ready Data Strategy: What Every Enterprise Should Get Right Before Scaling Artificial Intelligence
July 16, 2026Enterprise AI initiatives rarely stall because teams lack access to capable models. ...

What Social Media Analytics Actually Tell You – and What They Don’t
July 13, 2026If you work in data, you have probably watched a marketing team ...

Best 7 Revenue Intelligence Solutions for Technical Sales Teams
June 26, 2026Technical sales teams operate in a fundamentally different environment than most B2B ...

5 Best Social Intelligence Tools for 2026
June 15, 2026Social intelligence has become one of the most important capabilities for brands ...

The 2026 Data Observability Vendor Database: 20+ Platforms by Founding Year, Funding, Hosting, and Pricing
June 12, 2026The data observability market has evolved rapidly over the past five years. ...