Guide To Unsupervised Machine Learning: Use Cases
An information-driven mindset is one of the success factors for your business. But the data volume doesn’t boil down to just basic processing capacities. That’s where ML algorithms come on stage. What comes even earlier is unsupervised learning that studies the information and makes it meaningful.
Breaking down unsupervised machine learning
In the surrounding world, you can easily imagine a situation where a robot or artificial intelligence does not always have access to the best solution. Then we need the robot to be able to explore the world on its own and learn from the patterns.
With that being said, unsupervised learning is an ML algorithm that focuses on unlabeled data. Therefore, it organizes the dataset and makes sense of data.
The word “unsupervised” means that the algorithm works unguided, unlike supervised ML algorithms.
Unsupervised ML algorithm: How it works
Unlike supervised ML, there is no teacher offered which means no training will be provided to the machine. Therefore, the machine is set to define the hidden structure in an unlabeled dataset on its own.
The main aim of this ML algorithm is exploration. Unlike supervised machine learning that adheres to predefined rules, unsupervised ML is operating with unknown results and outlines them in the process.
The unsupervised ML algorithm is used to:
- Study the data structure and find clear patterns;
- Retrieve valuable input;
- Apply the gathered information to improve the effectiveness of the decision-making process.
Put simply, it specifies the information, goes in the raw of it, and points out its essence.
Unsupervised learning is classified into two categories of algorithms – clustering and dimensionality reduction.
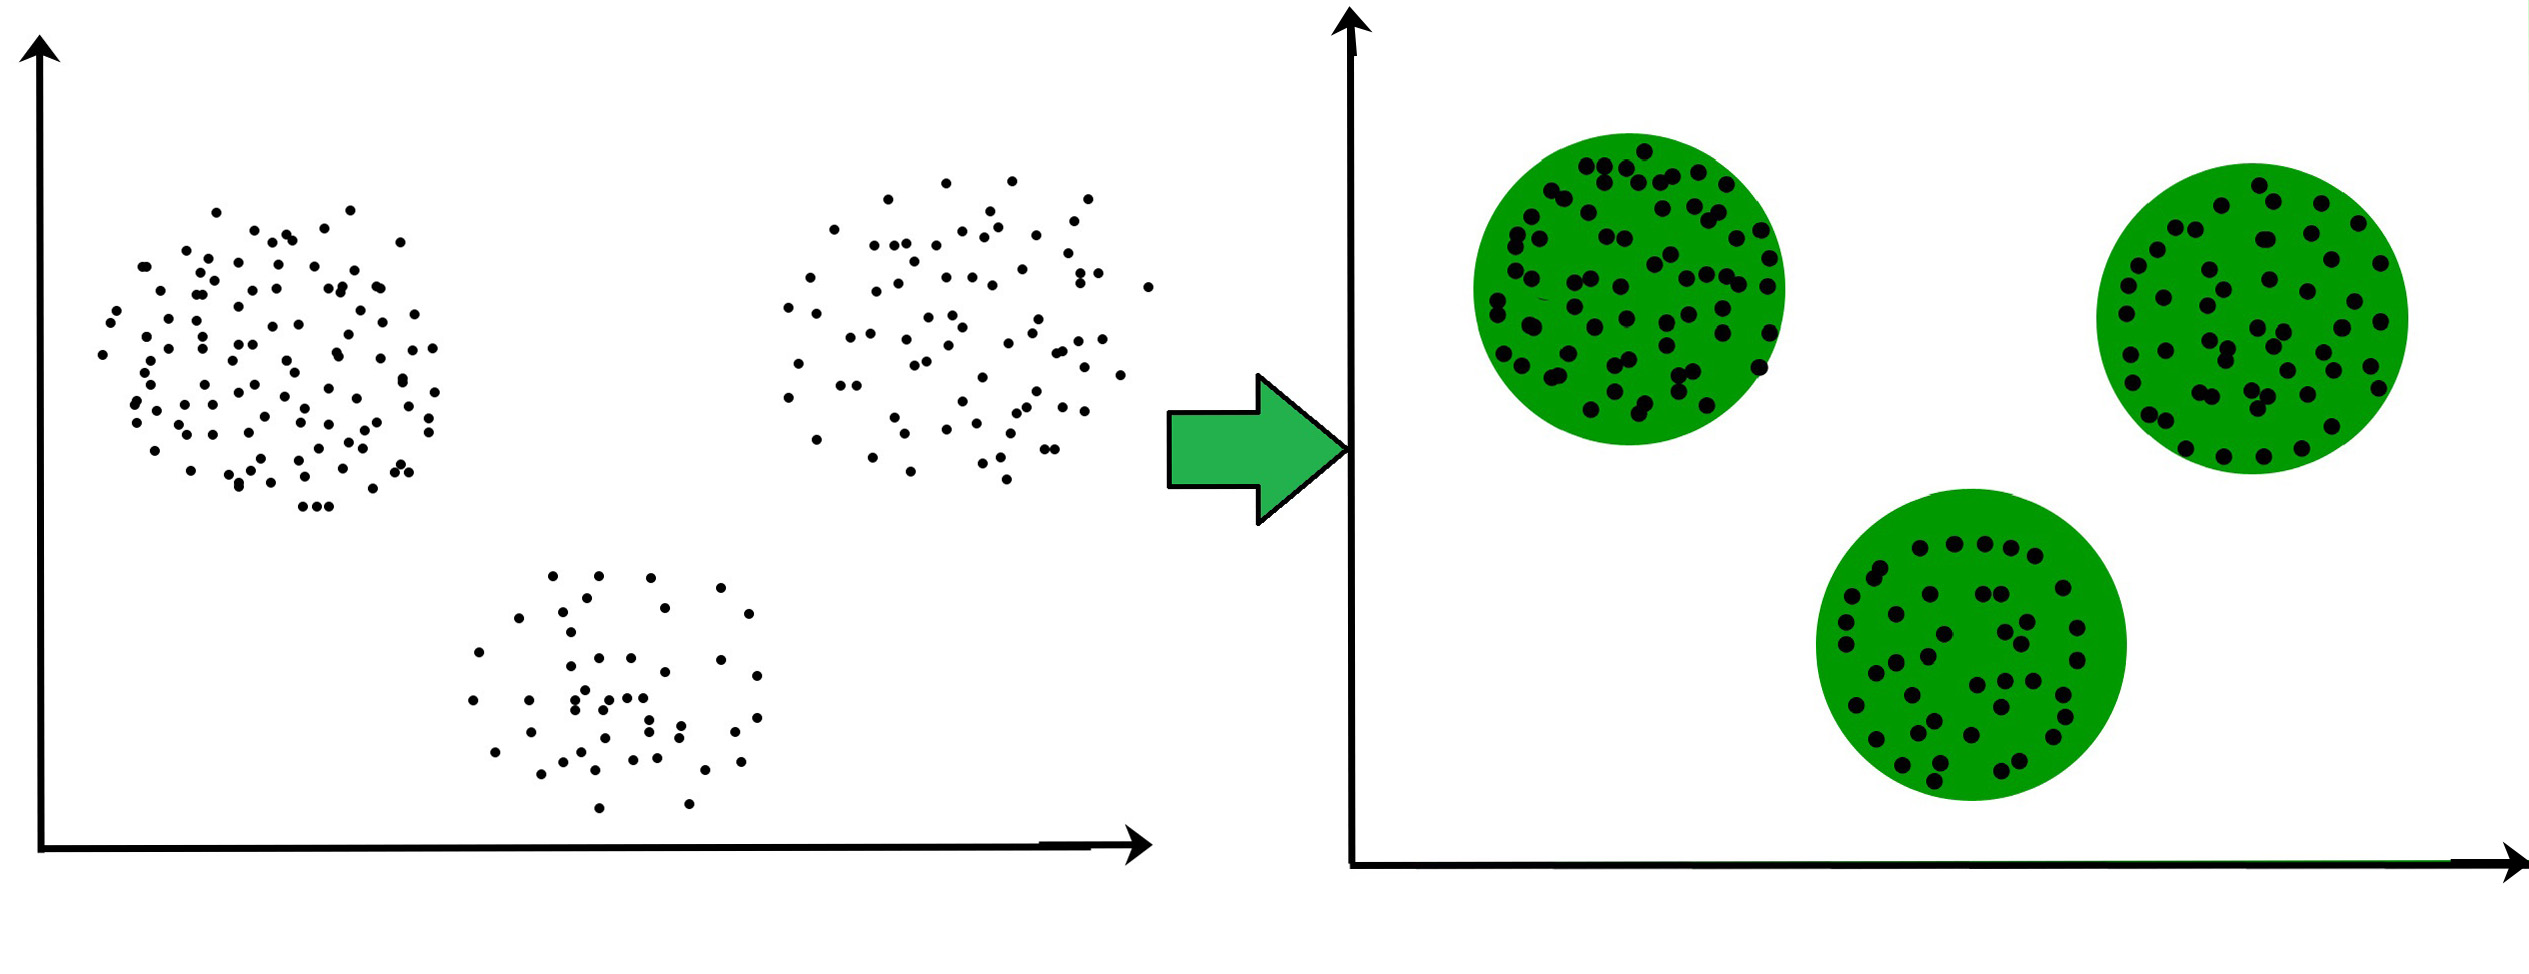
Clustering – Exploring the Data
Cluster analysis is intended for dividing a set of objects into homogeneous groups (clusters or classes). It is a task of multidimensional data classification.
The clustering process can be broken down into the following stages:
- Outlining the credentials that structure the prerequisite for each cluster. The credentials are then coordinated with the handled information to shape the groups.
- Classifying the dataset into particular clusters according to the shared features.
 Clustering methods are straightforward yet can work wonders. They call for dedicated efforts but can become a resource of valuable insight into the data.
What are the common use cases for clustering? There are quite a few:
- Marketing – for segmenting competitors and customers.
- Medicine – for classifying symptoms, patients, and drugs.
- Sociology – for classifying respondents into homogeneous groups and others.
Overall, clustering has proved itself well in all spheres of human activity.
Dimensionality Reduction – Transforming Data
Have you ever worked on a dataset with countless features? How about over 40k features? We have, and it’s an uphill struggle. Missing values, wrong and irrelevant data muddle the water and hamper effective analysis.
Dimensionality reduction helps reduce the number of features while keeping valuable information and maintaining the model performance.
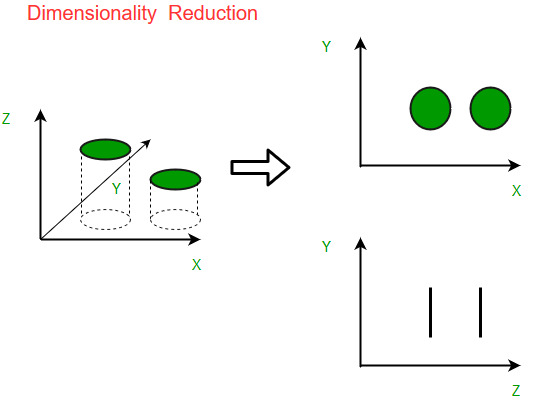 In practice, dimensionality reduction is the process of reducing the number of features or valuables in the review.
7 Unsupervised ML Real Life Cases
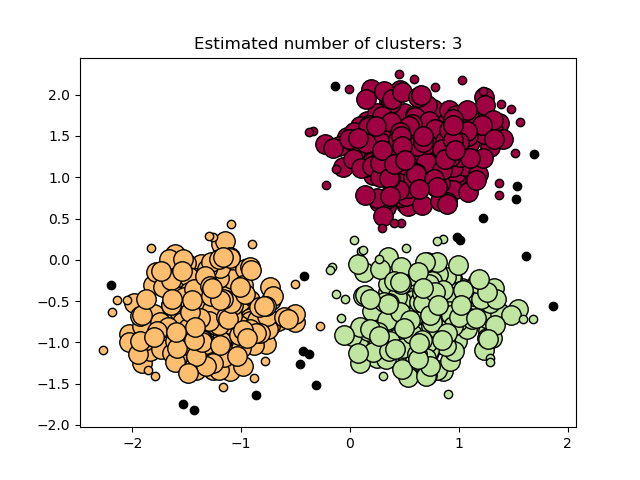
1. k-means Clustering – Data Mining, Pattern Recognition
The k-means clustering algorithm is the primary algorithm in unsupervised ML operation. As for data mining, it’s used to cluster observations into groups of related observations without defined relationships.
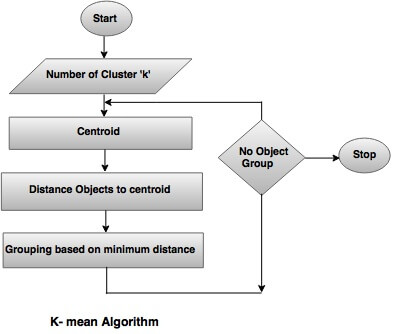 This type of clustering is the go-to tool in the data-mining operation. It is also used for:
- Document classification;
- Delivery store optimization;
- Customer segmentation;
- Pattern recognition.
2. Hidden Markov Model – Gene Prediction, Text Translation
Hidden Markov Model is one of the most sophisticated ML algorithms. It refers to a statistical model that describes the evolution of observable events and groups the elements.
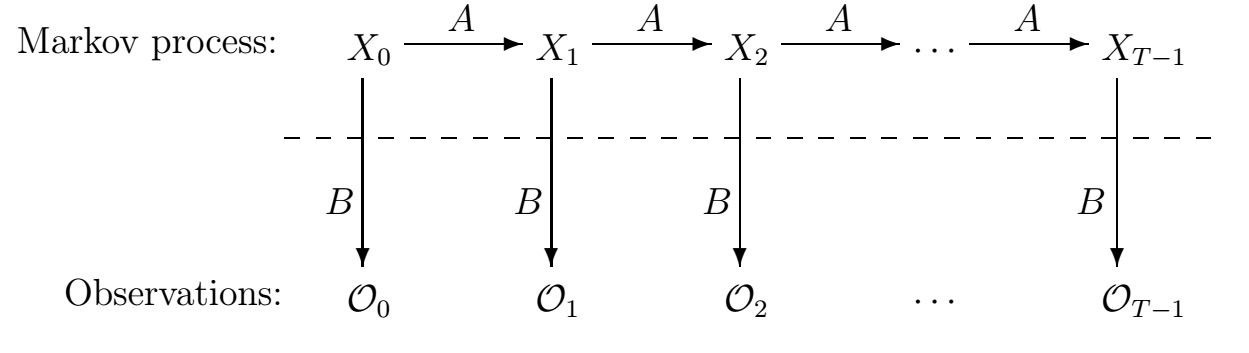 This technology has gained great popularity thanks to a successful application and further development in the field of automatic speech recognition. Markov’s research on hidden models has surpassed all competing approaches and is the dominant processing paradigm.
Hidden Markov Model real-life applications also include:
- Facial expression recognition;
- Gene prediction;
- Gesture recognition;
- Text translation and others.
Hidden Markov Models are also applied in data analytics operations for clustering purposes. It looks for similarities between the objects in the dataset and studies its structure.
3. DBSCAN Clustering – Customer Service Personalization, Data Mining
DBSCAN Clustering stands for Density-based Spatial Clustering of Applications with Noise. This type of clustering is widely applicable in data wrangling and data mining for the following purposes:
- Studying the data structure;
- Pinpointing shared similarities in the data;
- Defining data trends.
In general, DBSCAN operation entails the following steps:
- The algorithm assembles data bits that are close to each other.
- Then it classifies the data based on the exposed commons.
 DBSCAN use cases include:
- Market research;
- Pattern recognition’
- Image processing;
- Customer service personalization;
- Data mining.
4. Principal component analysis (PCA) – Facial recognition, image compression
Principal component analysis is one of the main ways to reduce the data size while losing the smallest amount of information. It is a sweet and simple algorithm that gets the work done. In most cases, it seems to be the only game in town.
Technically, PCA replaces the original data with some aggregated values in the new space, while solving two tasks. It combines the most values in a smaller more informative number of parameters and reduces noise in the data.
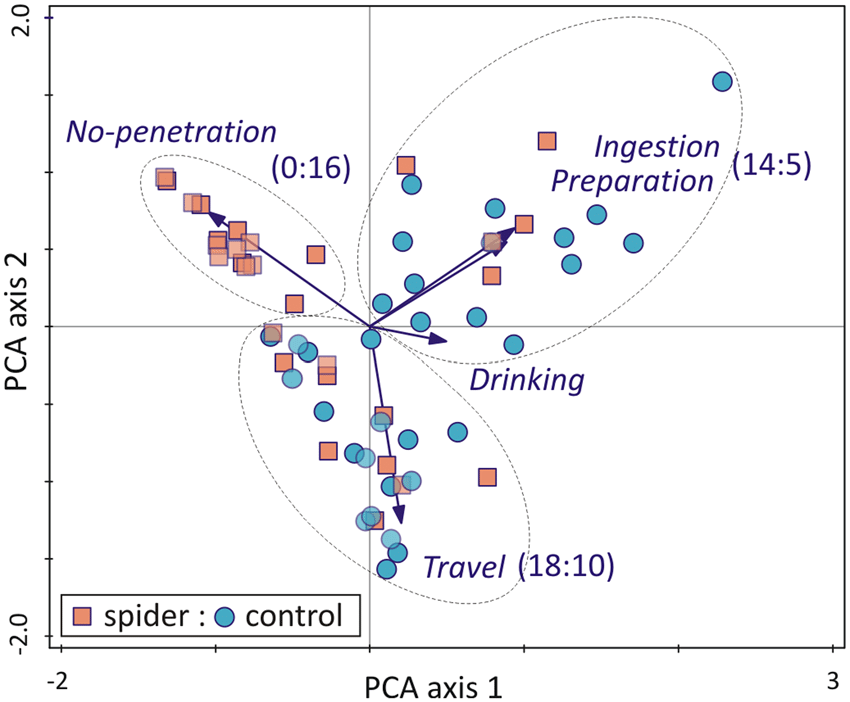 As a visualization tool – PCA is great at showing an aerial view of the operation. It is also used in the field of:
- Facial recognition;
- Image compression;
- Data mining (finding patterns in data of high dimension).
5. t-SNE – Data Analytics Visualization
t-SNE or T-distributed Stochastic Neighbor Embedding is another popular algorithm for data visualization. It is an uncontrollable, non-linear technique mainly used for data investigation and visualization of multidimensional data. Simply put, t-SNE gives you an idea of how data is located in multidimensional space.
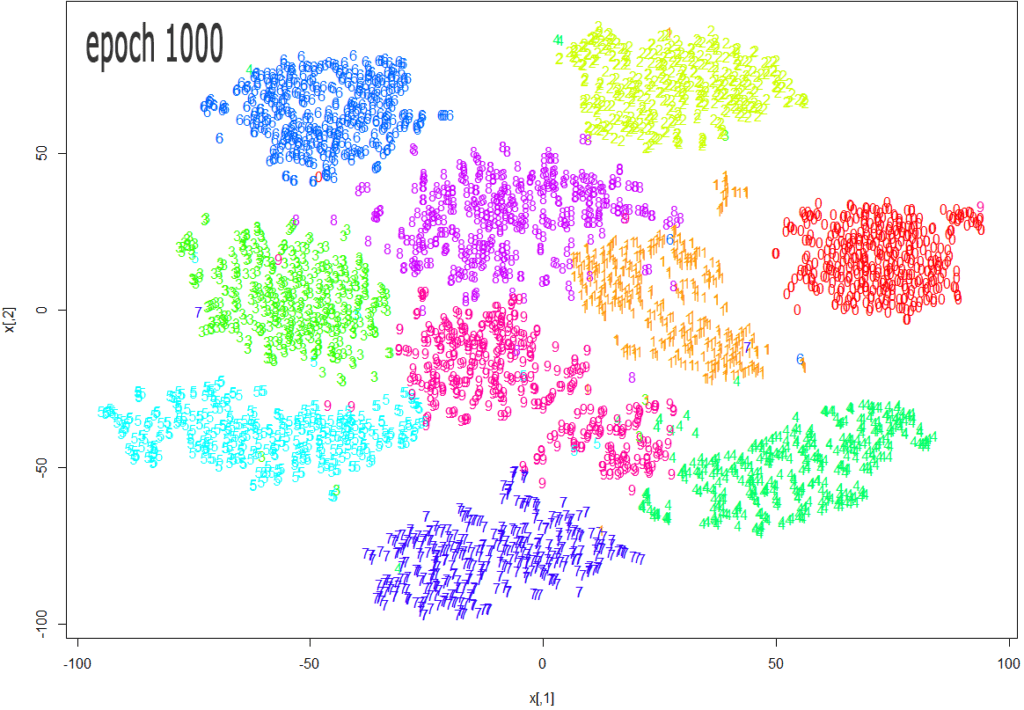 The whole process looks like this:
- The t-SNE algorithm calculates the measure of similarity between pairs of instances in high dimensional and low dimensional space.
- It then tries to optimize these two measures of similarity using the cost function.
- After that, the algorithm reduces the dissimilarity between conditional odds in high-dimensional and low-dimensional spaces for the better depiction of data points in a low-dimensional space.
t-SNE is a go-to tool for:
- Computer security research;
- Biomedical signal processing;
- Market segmentation.
6. Singular value decomposition (SVD) – Recommender Systems, NLP
SVD is an ML algorithm used to decompose the material matrix to bring it to a canonical form. It shows the geometric structure of the matrix and allows you to visualize the available data. Singular decomposition is used for a wide variety of tasks, from the least-square approach and equation systems to image compression.
Singular value decomposition points out the major features in a dataset and makes it convenient for further operation. An excellent real-life example is a consumer suggestion that offers the best fit for those H&M jeans.
 In a way, SVD makes use of appropriate information components to fit a particular cause.
It can also be used:
- In natural language processing (matrices of word occurrences or word frequencies in documents);
- To withdraw specific data from the dataset (such as, extract information on every consumer based in California);
- To predict what a user may like among a list of given items (recommender engine).
7. Association rule – Predictive Analytics
Association rule is one of the fundamental algorithms of unsupervised ML. Essentially, it is a simple method of searching for relationships (associations) in datasets, or, to be more precise, itemsets, which are widely used in real life. Overall, the association rule comes down to a straightforward formula that states “People who bought X, also bought Y”.
While association rules are widely applicable, the best way to showcase the concept is via an eCommerce-related example:
- Market basket analysis. The algorithm identifies typical patterns of purchases and jointly purchased goods. The results obtained allow optimizing the assortment and its placement in the sales areas, improving stock management, increasing sales volumes by offering related products to customers.
- Cross-selling and up-selling. Based on behavioral patterns, the algorithm allows you to identify customers who are inclined to respond to personalized offers and cross-selling.
- Direct mail – direct targeted mailing that promotes offers to potential and existing customers. It is a highly effective, simple, and cheap marketing tool.
Conclusion
The effective use of data has always been a big-ticket in the marketing world. Unsupervised machine learning algorithms allow you to classify the data to define your target audience’s preferences or keep hackers at bay. It may seem complicated, with algorithm names and model types seemingly proliferating without end. However,
with real-life applications galore, unsupervised ML is an indispensable method that gives you a business advantage in data crunching.
Related Posts

Building an AI-Ready Data Strategy: What Every Enterprise Should Get Right Before Scaling Artificial Intelligence
July 16, 2026Enterprise AI initiatives rarely stall because teams lack access to capable models. ...

What Social Media Analytics Actually Tell You – and What They Don’t
July 13, 2026If you work in data, you have probably watched a marketing team ...

Best 7 Revenue Intelligence Solutions for Technical Sales Teams
June 26, 2026Technical sales teams operate in a fundamentally different environment than most B2B ...

Primary Considerations for Building Resilience in Your Disaster Recovery Plan
June 15, 2026Without a solid disaster plan, system failures can plunge operations into the ...

5 Best Social Intelligence Tools for 2026
June 15, 2026Social intelligence has become one of the most important capabilities for brands ...