Efficient Data Analysis with dbForge Studio for PostgreSQL: A Comprehensive Overview
dbForge Studio for PostgreSQL is an advanced integrated development environment (IDE) tailored for PostgreSQL data analysis experts and administrators. It provides an extensive array of features that assist data analysts and developers in enhancing their productivity. Some of the key features of dbForge Studio for PostgreSQL include:
- Import and Export Data: PostgreSQL GUI client allows users to easily export and import data to/from various formats such as Excel, CSV, and XML.
- Code Completion: The software includes a code completion feature that helps developers write SQL code more quickly and accurately. Moreover, you can further sort and filter the query output.
- Schema and data compare: The dbForge Studio contains a schema and data generator tool which helps to perform the schema comparison and data comparison between multiple databases. In this article, I explained the feature in more detail.
- Data Generator: The dbForge Studio for PostgreSQL allows to generate the dummy data, which can be used to test the various use cases. I have explained the feature in more detail.
- Query Profiler: The dbForge Studio has a query profiler tool that helps to diagnose and fix poorly performing queries. It also includes visual query plans. I have explained the feature in detail.
- Report Designer: The dbForge studio has reporting tools that allow users to create new reports from the tables and views to visualize the underlying data.
Overall, the robust and feature-rich IDE dbForge Studio for PostgreSQL can significantly increase the productivity and efficiency of PostgreSQL database developers, data analysts, and administrators.
In this article, we will learn about three exciting features which are following:
- Data generator tools
- Schema comparison tool.
- Query Profiler tool.
Let us understand how they work and what benefits they provide.
Data Generator tools
The Data Generator tool in dbForge Studio for PostgreSQL provides a user-friendly interface that makes creating custom data sets for your PostgreSQL tables easy. Here are some of the key features of the Data Generator tool:
- Rich Data Generation Options: The tool provides numerous options for data generation, such as predefined data generators for various data types, including strings, numbers, dates, and Booleans. You can define your data generation rules using regular expressions, templates, or scripts because it also supports custom data generators.
- Customizable Data Generation Rules: Each column in a PostgreSQL table has its own data generation rules, where you can define the data type, range, format, and other properties. You can also establish dependencies between columns to produce related data like foreign keys and cross-table references.
- Realistic Data Generation: The software can generate realistic data, including names, addresses, phone numbers, and email addresses with meaningful patterns. It also allows you to generate data with distribution, mimicking common patterns in the real world like the normal distribution for numbers.
- Large-Scale Data Generation: With the help of the dbForge Studio for PostgreSQL Data Generator, you can easily generate millions of rows of data with minimal effort. This is especially helpful for large data usage scenarios like performance testing and load testing.
- Preview and Editing: Before applying the generated data to your PostgreSQL tables, you can view a preview of it. The output data can be saved as SQL scripts for later use.
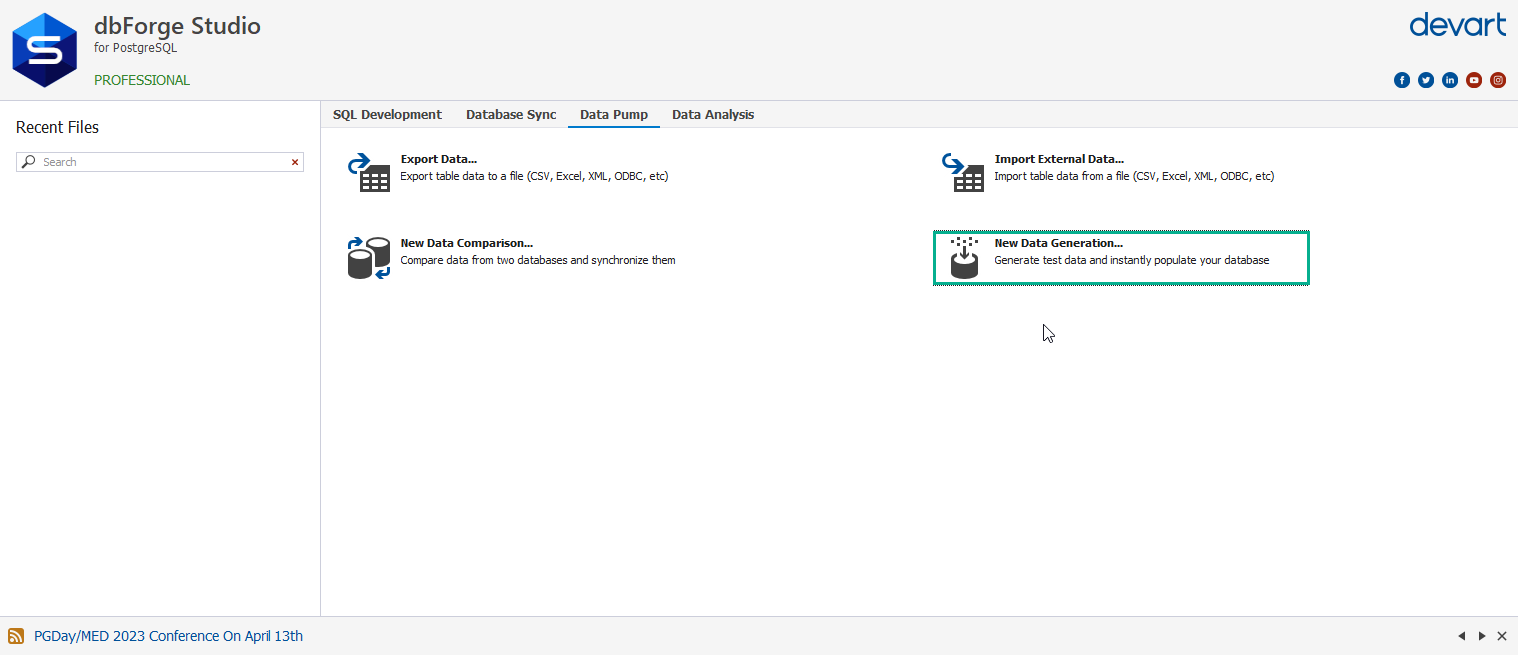
Let me explain its usage with a simple example.
For demonstration, I have created a sample database named dev_dvdrental which contains three tables named film, film_actor, and film_category.
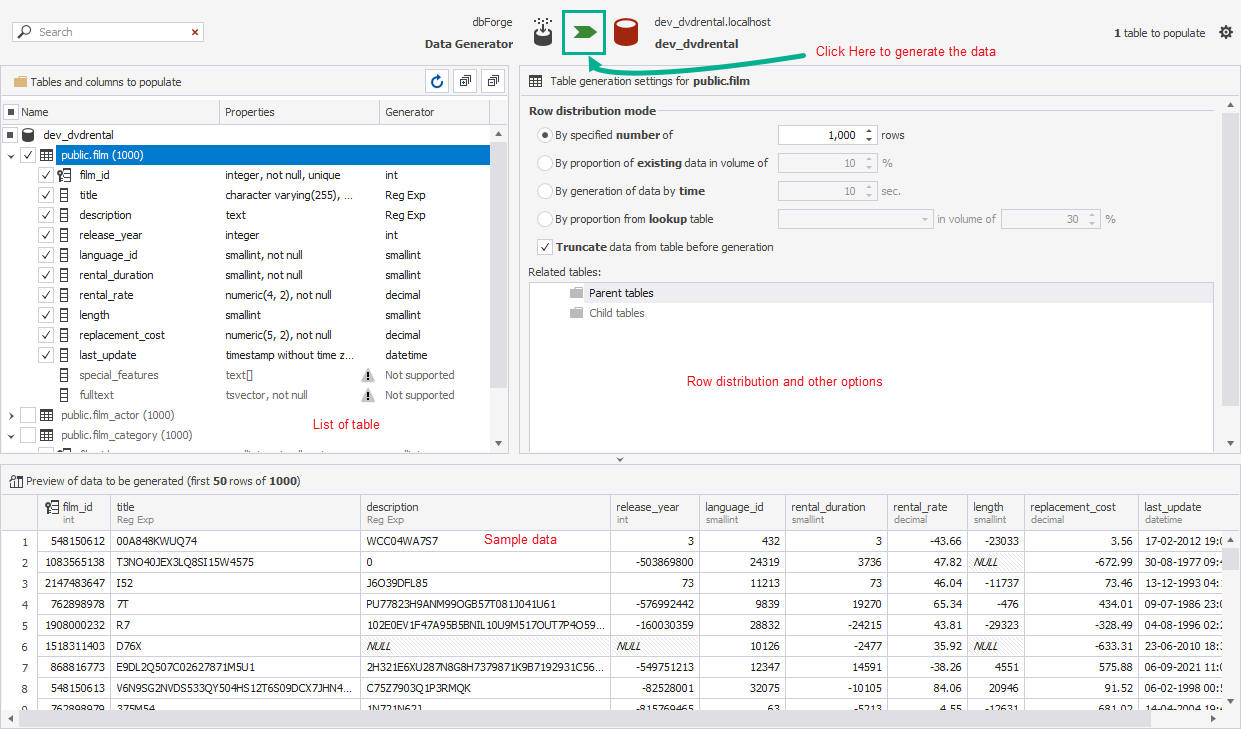
In the data generation window, you can see three pans that contain the following options:
- The left pan lists every table in the database. You can choose between all tables and individual tables here. You can pick out individual columns or all of them. To test out various scenarios and features, it can be useful to generate data for individual fields or tables.
- The right pan contains the options to configure the row distribution parameters. The following parameters can be configured.
- A number of volumes of records can be inserted in selected tables.
- You can choose whether to truncate existing records from the table or not.
- View parent and child tables associated with the selected table.
- The third pan shows the demo records that are going to be inserted.
See the following image:
Once the options are set, click on the Generate Data button. The Data generation process begins. Once the process is complete, run the SELECT statements to view the data of film tables.
SELECT * FROM public.film f
Query Output
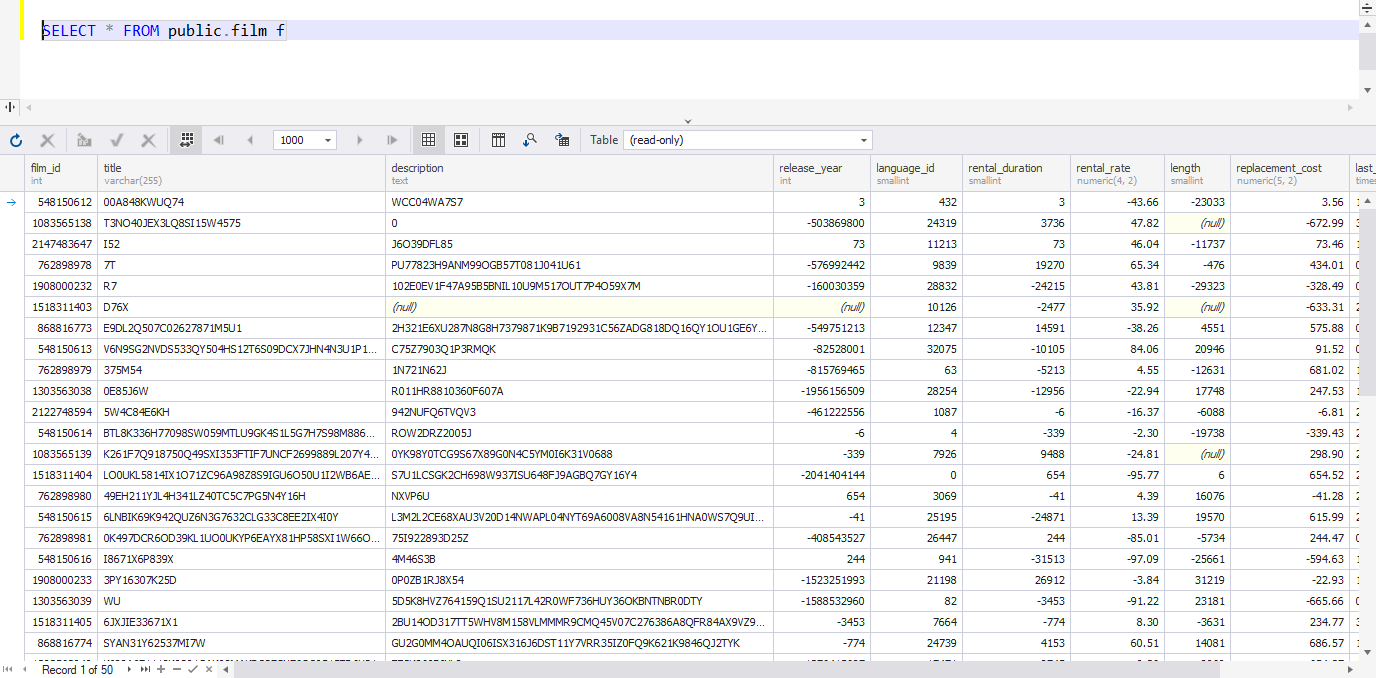
As you can see, the dummy records have been inserted in the film table.
To sum up, the Data Generator tool in dbForge Studio for PostgreSQL is an effective and useful tool for database developers, testers, and administrators because it allows them to generate real and meaningful test data.
Schema Comparison Tool
Developers can easily examine the similarities and differences between two PostgreSQL databases or database schemas with the help of the dbForge Studio for PostgreSQL’s schema comparison tool. Database objects like tables, views, functions, triggers, and more can be compared and contrasted in a visual representation of the changes that have occurred between the two schemas. The results of the comparison are presented in an intuitive interface that clarifies the differences between the two schemas.
In simple words, the tool provides the following details:
- It populates the list of mismatched objects (Tables, Index) between two databases, giving the list of database objects that exist in one database but not in another.
- It also shows the list of mismatched columns. For example, it shows the difference of datatypes in the source and destination columns. Total number of columns in a table, for example, if a source table contains five columns and the destination table has four columns.
- It shows the list of stored procedures with different definitions and query details, which are mismatches between source and destination databases.
Let me explain it with a simple example:
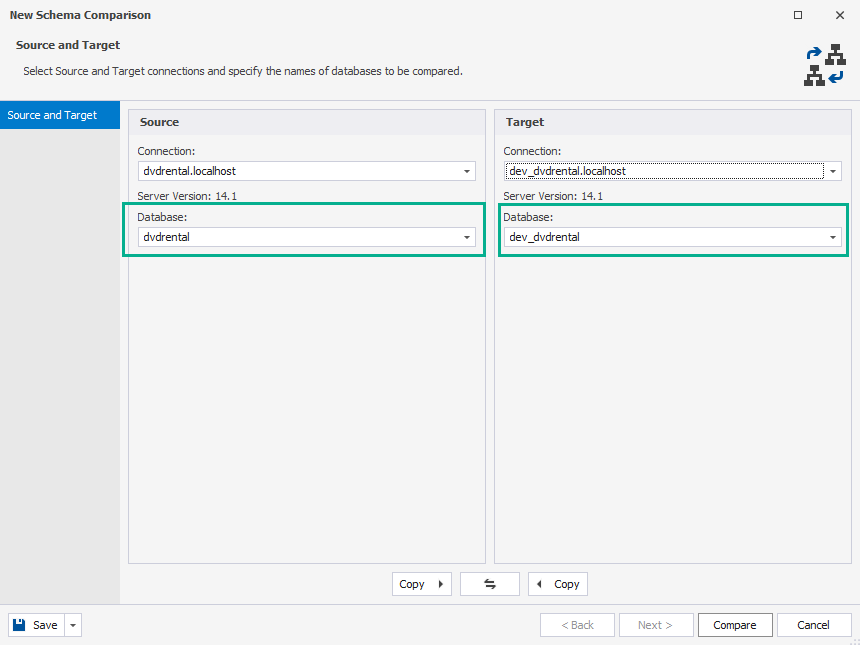
For the demonstration, I am comparing two databases named dev_dvdrentel and dvdrental. To begin the comparison process, click on New Schema Comparison from the Database Sync tab.
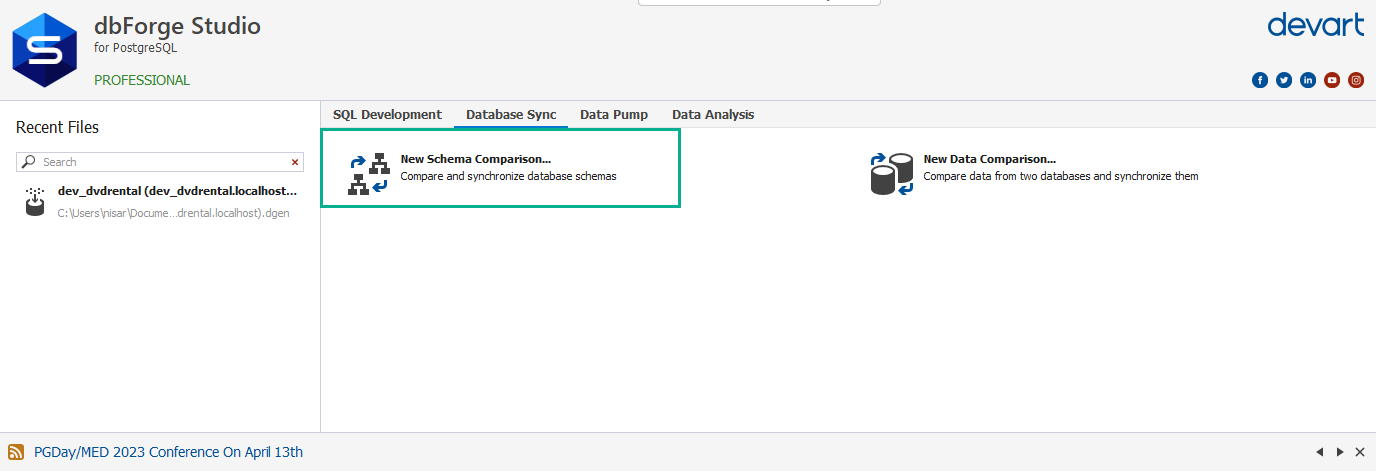
The New schema comparison wizard starts. Specify the source and target databases that you want to compare. Click on Compare to begin the database comparison process.
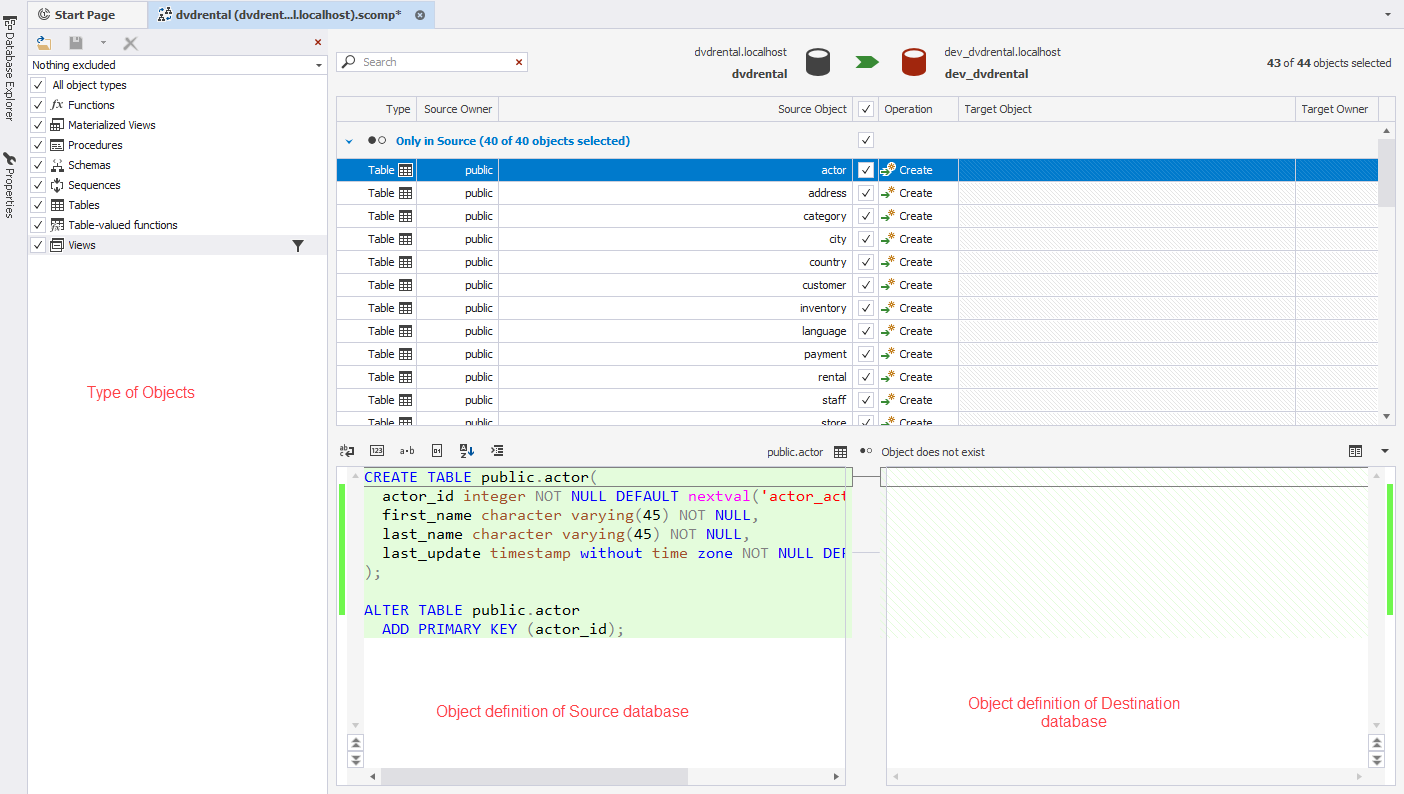
You can see the following pans in the comparison tool project window:
- Type of Objects.
- CREATE statement of Object selected in Source pan.
- CREATE statement of Object in Destination pan.
- List of objects in Source and Target.
The following is the image for the comparison project window.
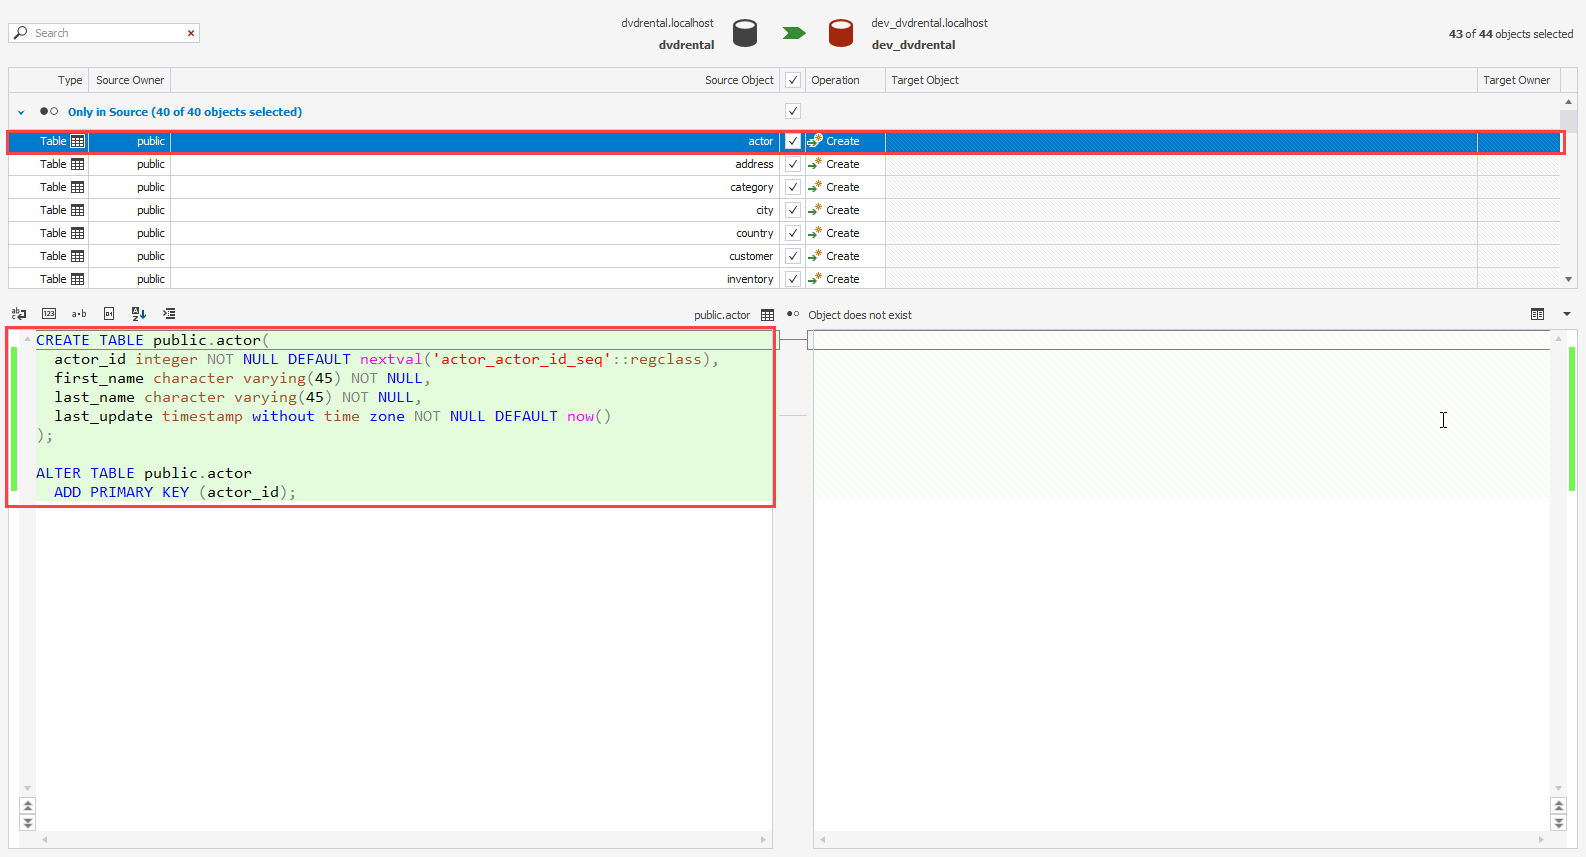
Let us see how it can be helpful to compare the schema. The first example shows the missing objects in the source and target database. In this demo, the actor table is missing in the dev_dvdrental database. You can use the CREATE TABLE script to add a public.actor table in the dev_dvdrental database.
The second example shows the difference between tables of source and target databases. In this example, the public.film table exists in both databases, but the table definition is different. The source table contains three columns named rating, special_features, and fulltext missing in the target table. Moreover, a foreign key is also missing from the target database.
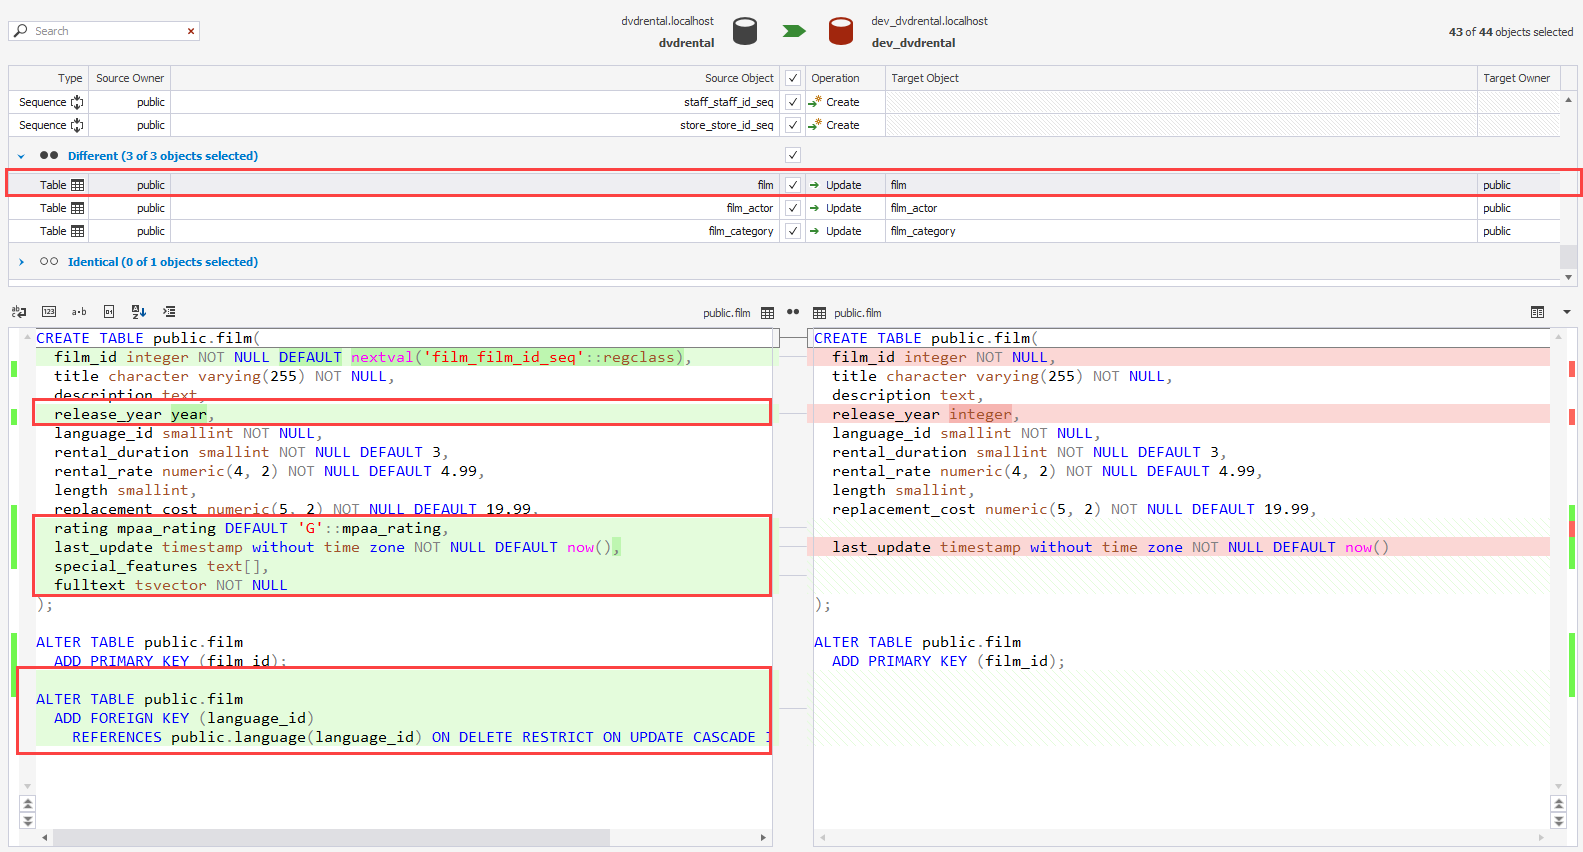
Once differences are identified, you can synchronize source and target tables by creating/modifying the table definition.
PostgreSQL Profiler Tool
dbForge Studio for PostgreSQL is a powerful tool designed for database development and administration tasks with PostgreSQL. It provides various features, including a query profiler, which helps optimize SQL queries for better performance.
dbForge Studio for PostgreSQL includes a query profiler for examining SQL query performance and pinpointing potential slowdowns. Each query’s execution time, CPU utilization, and I/O statistics are displayed in great detail. You can use this tool to pinpoint the queries that are slowing down your PostgreSQL database.
Here are some key features of the query profiler in dbForge Studio for PostgreSQL:
- Query Execution Analysis: The query profiler captures the execution time of each SQL query, providing detailed information on the time each query takes to execute. This helps you identify slow-performing queries that may need optimization.
- CPU and I/O Usage Analysis: The query profiler also provides information on the CPU and I/O usage of each query, allowing you to identify queries that may be causing high CPU or I/O utilization, which could be potential performance bottlenecks.
- Query Plan Analysis: The query profiler allows you to analyze the query execution plans generated by PostgreSQL for each query. This helps you understand how PostgreSQL executes your queries and identify any inefficiencies in the query plans.
- Visual Analysis: The query profiler provides a visual representation of the query execution statistics, including the query execution plan, which makes it easy to analyze and identify performance issues.
- Query Optimization Suggestions: The query profiler may also provide suggestions for query optimization, which helps you improve your SQL queries’ performance.
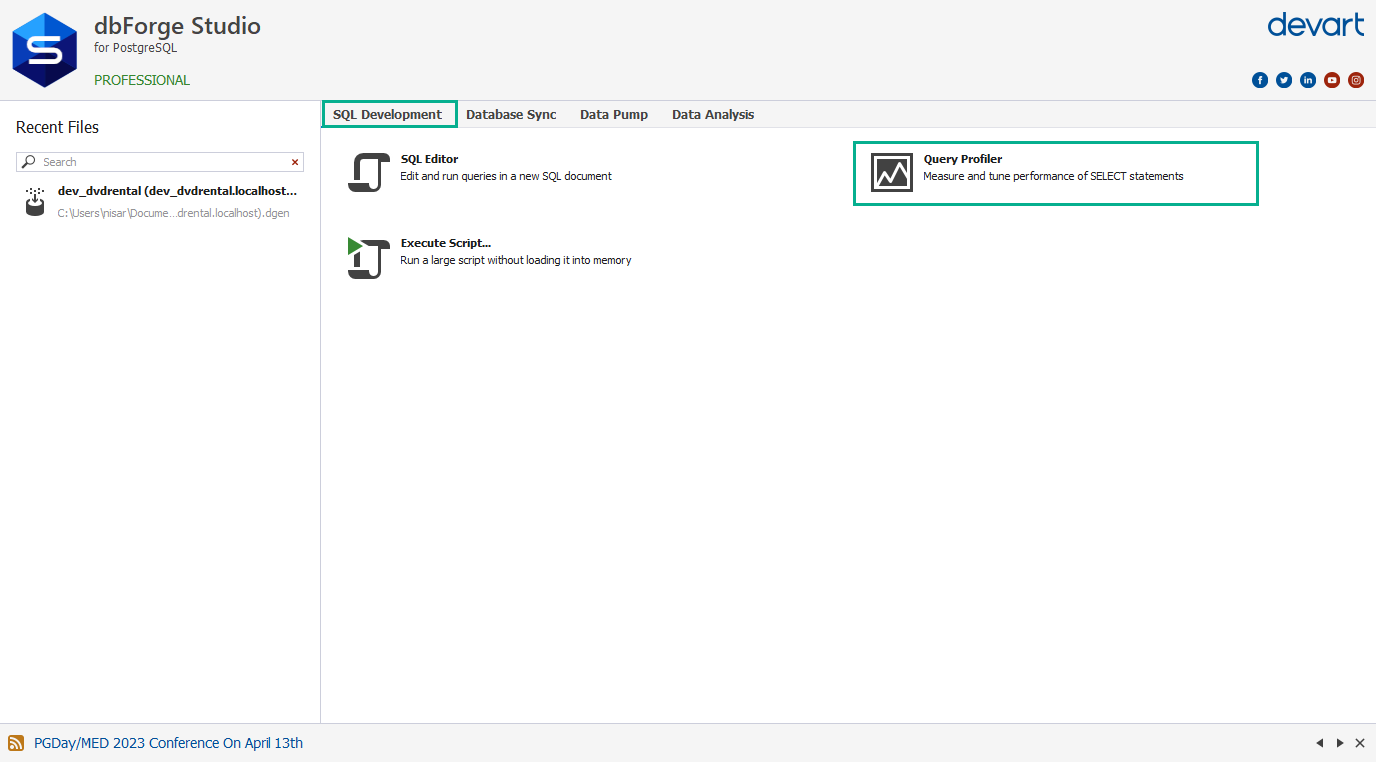
The Query profiler can be enabled from the main screen of dbForge Studio, or it can be enabled from the menu bar.
Let me show you how it works. For demonstration, I am going to execute the following SQL query. Before executing it, I am enabling the Profiler mode.
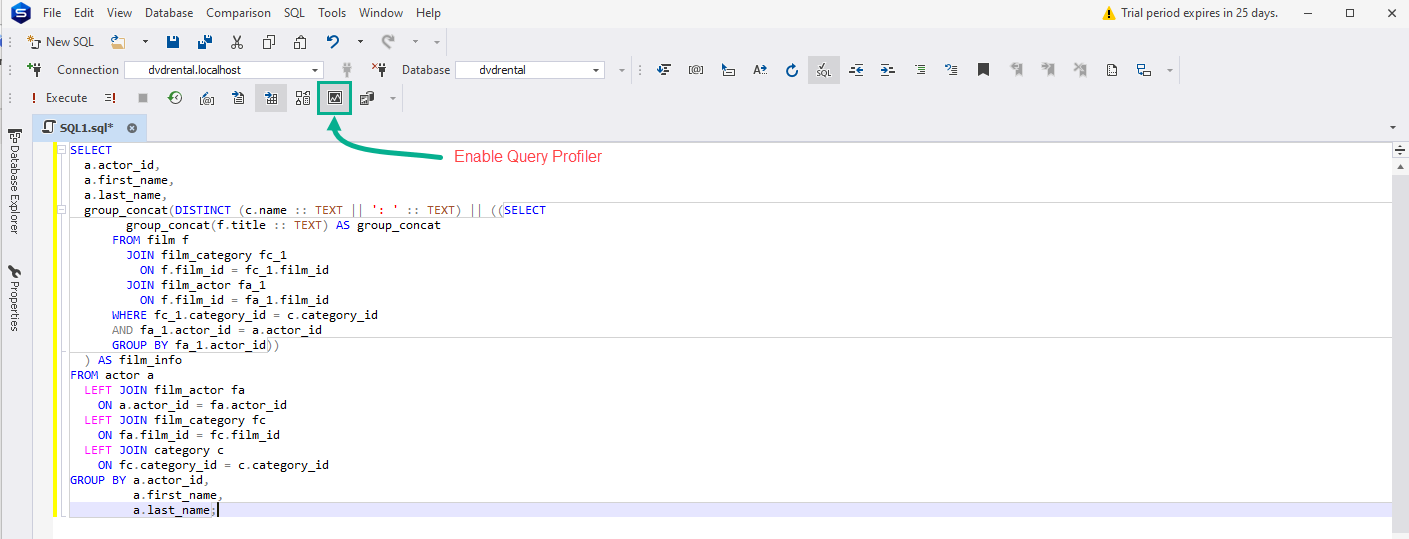
The query which I am executing is the following:
SELECT
  a.actor_id,
  a.first_name,
  a.last_name,
  group_concat(DISTINCT (c.name :: TEXT || ': ' :: TEXT) || ((SELECT         group_concat(f.title :: TEXT) AS group_concat       FROM film f         JOIN film_category fc_1
          ON f.film_id = fc_1.film_id
        JOIN film_actor fa_1

          ON f.film_id = fa_1.film_id
      WHERE fc_1.category_id = c.category_id
      AND fa_1.actor_id = a.actor_id
      GROUP BY fa_1.actor_id))  ) AS film_info
FROM actor a   LEFT JOIN film_actor fa     ON a.actor_id = fa.actor_id   LEFT JOIN film_category fc     ON fa.film_id = fc.film_id

  LEFT JOIN category c
    ON fc.category_id = c.category_id GROUP BY a.actor_id,
          a.first_name,
          a.last_name;
The query profiler shows the following details:
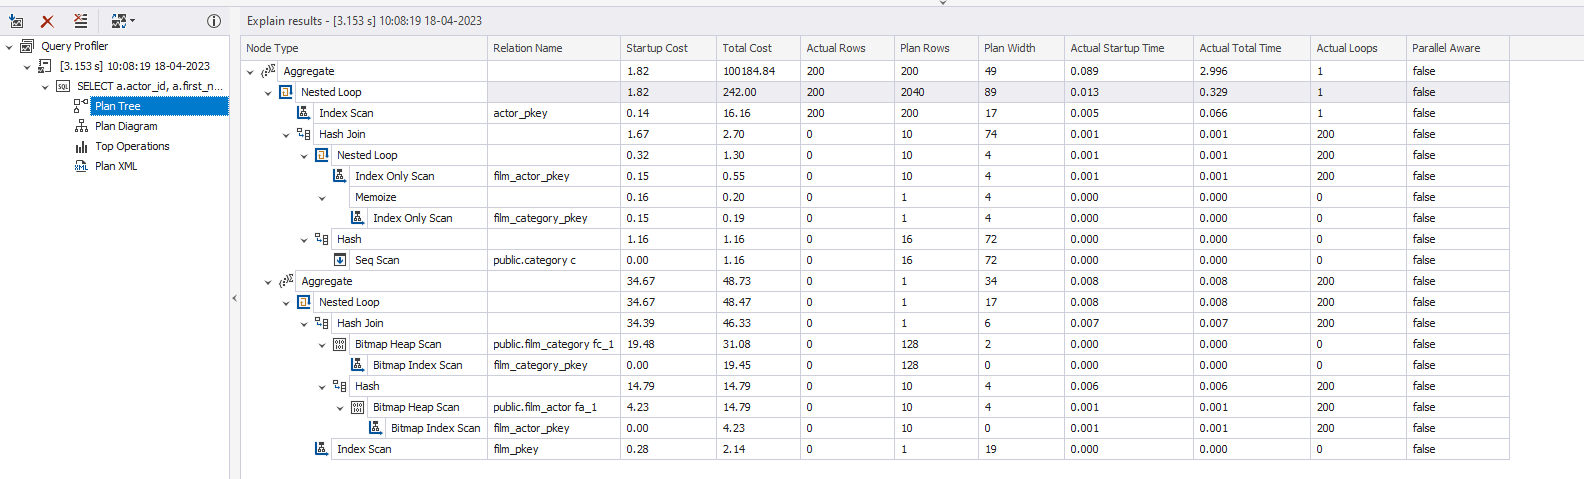
Plan Tree:
The query profiler shows the Plan tree of the query execution plan. It is a tabular representation of the query execution plan. It shows the list of operations (Index Scan, Hash Joins, Sequential scan, etc.) and the total cost associated with each operation.
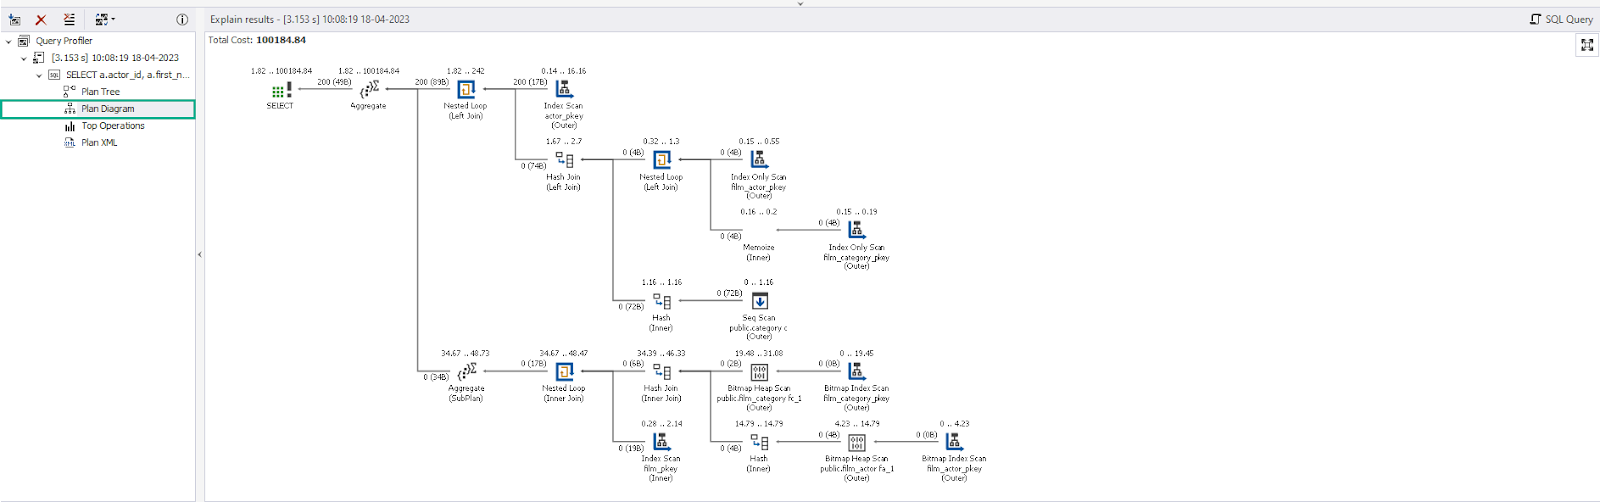
Plan Diagram:
The plan diagram is a visual representation of how the query was executed. In simple words, it is a query execution plan.
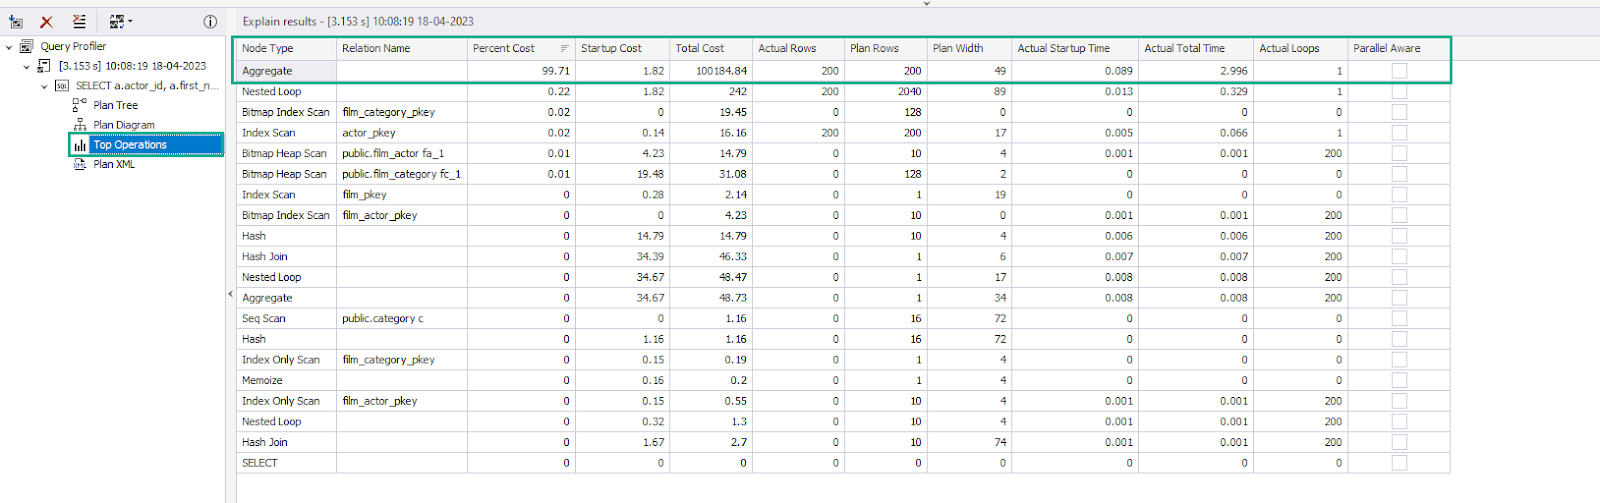
Top operators
The dbForge Studio shows the list of top operators of query execution. This helps us to understand which operation of query execution is taking more time. In our example, the Aggregate operation’s cost is 99%.
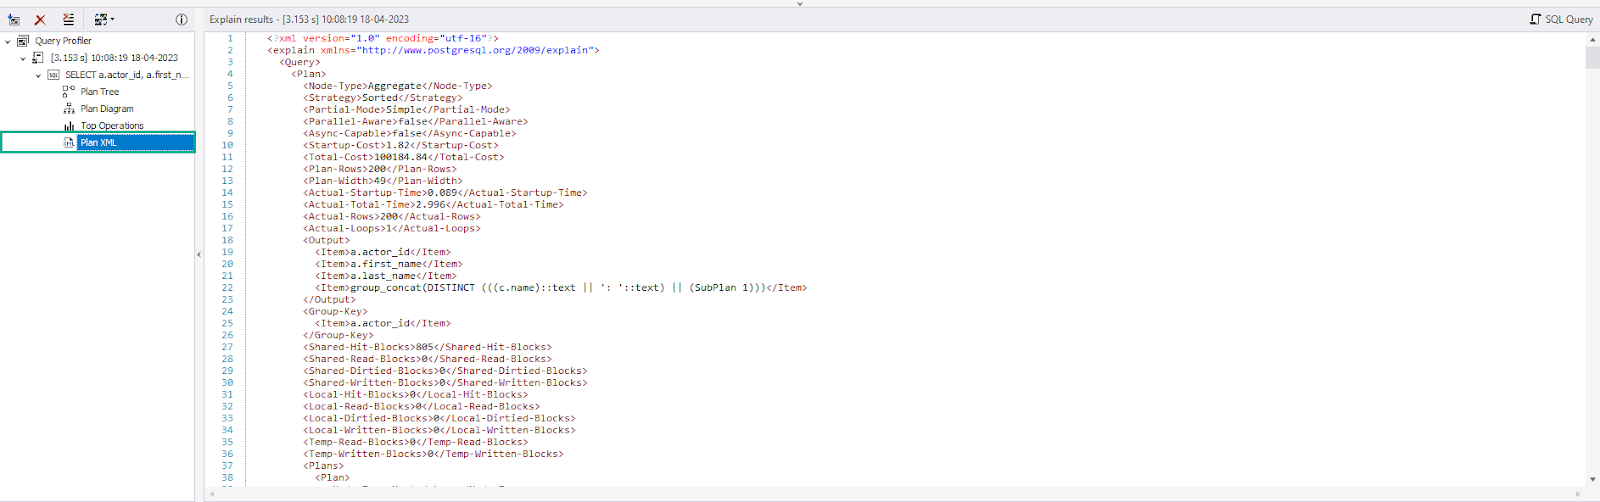
Plan XML
As the name suggests the plan XML is an XML representation of the query execution plan.
Even though dbForge Studio for PostgreSQL does not have a dedicated Query Profiler tool, the query profiler provides other powerful features for query analysis and optimization.
Summary
The dbForge Studio for PostgreSQL is a comprehensive IDE (Integrated Development Environment) designed for PostgreSQL database management and development. This article taught us about Data Generator, Query Profiler, and Schema compare tools.
Related Posts

What Social Media Analytics Actually Tell You – and What They Don’t
July 13, 2026If you work in data, you have probably watched a marketing team ...

Best 7 Revenue Intelligence Solutions for Technical Sales Teams
June 26, 2026Technical sales teams operate in a fundamentally different environment than most B2B ...

5 Best Social Intelligence Tools for 2026
June 15, 2026Social intelligence has become one of the most important capabilities for brands ...

The 2026 Data Observability Vendor Database: 20+ Platforms by Founding Year, Funding, Hosting, and Pricing
June 12, 2026The data observability market has evolved rapidly over the past five years. ...

7 Top Autonomous AI Pentesting Platforms in 2026
June 10, 2026Autonomous penetration testing is becoming one of the most important changes in ...