Most Useful DAX functions in Power BI you need to know
Do you want to dive into the analysis of your company and product list over different ranges quickly? Are you looking for the best way that helps you customize specific variables?
“Power BI Desktop unifies the former Excel Power Tools (Power Pivot, Power Query and Power View) into one vastly improved, stand-alone, data discovery desktop application built on a modernized HTML5 visualization framework.”
― Edward Price, Applied Microsoft Power BI: Bring your data to life!
If yes, then DAX functions in Power BI can help you reach your goals. Before we discuss DAX functions, let’s have a brief intro about Power BI.
 Power BI is one of the amazing free tools that helps in visualizing the data and share insight into the company efficiently and quickly. It’s easy to use interface, and excellent features allow the users to track and review business metrics without any challenge.
What is Power BI?
Power BI is a popular and incredibly powerful business intelligence tool developed by Microsoft. It has different flavors and offerings. The most basic version is free but it has the ability to perform mid-sized business intelligence exercises easily.
In broad terms, Power BI is a cloud-based business analytics solution suite that provides the necessary tools to turn vast volumes of data across silos into accessible information. It has been consistently ranked in the Gartner BI Magic Quadrant.
Power BI is celebrated for its versatility, interactivity, aesthetic designs, extensive connectivity to databases and ease of creating low-effort dashboards. It also leverages support from other tools from its Microsoft ecosystem – Azure, Cortana, SQL Server, Azure Active Directory, Azure Blob Storage, etc., highlighting the importance of collaboration with programming experts to maximize its utility.
Here are a couple of cool things Power BI can do:
- Real-time alerts and visualization for monitoring the health of manufacturing equipment. This is done by passing IoT sensor data through IoT Azure Hub, Azure Data Factory, Cognos DB and then analyzed in Power BI
- Create and fetch charts and Power BI reports and dashboards by giving voice instructions using Windows voice assistant Cortana.
See this article for more details on Power BI: Beginners Guide to Power BI.
What is DAX and its importance in Power BI
Data Analysis Expressions (DAX) is a syntax language that includes expressions and formulas used for analyzing and calculating data. These expressions are a combination of constants, functions, and operators that leads to accurate results. It would not be wrong if we call it an advanced version of MX excel, having high-end capability of managing and manipulating data.
DAX functions play an essential role in Power BI. It not only allows data analytics to use datasets to its fullest but also will enable them to find new ways that help them in calculating the values and come up with valuable results. All the results that are generated by using DAX functions are both intuitive and discerning.
 Source: wallstreetmo
Data Analytics Expressions (DAX): What are they and why are they needed?
We can read data into Power BI from CSV files or from a database. We can also merge tables in Power BI. Quite often, the data required for plotting is readily available in table columns (though that’s not always the case).
Consider a situation where we need to modify or change the data to improve our dashboards. Suppose those custom modifications we need are not readily available in Power BI. What do we do then? How can we perform this kind of modification and data analysis?
The answer is DAX (short for Data Analysis Expressions). DAX is used to bring some meaningful information hidden inside the raw data. In simple words, DAX is used for data manipulation.
There are certain rules we have to follow for using DAX. You’ll understand these rules quickly if you have had any Excel training or are familiar with Excel functions. DAX is just an advanced form of that.
DAX Calculation Types:
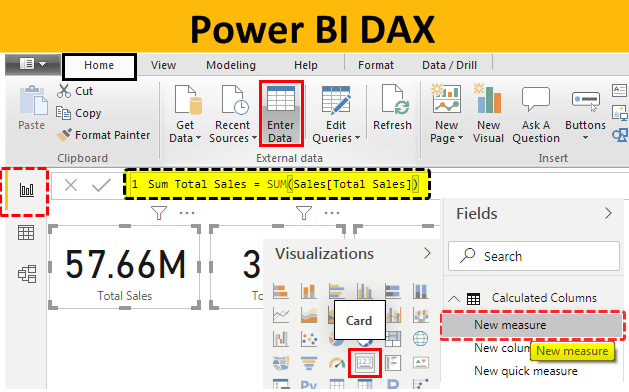
There are two places where we write DAX:
- Calculated columns are very similar to regular columns that we see in most datasets. The difference is that calculated columns are the result of our computations by using two or more columns or using columns from different tables. They can be used when we want to perform row-wise calculations
- Calculated Measure, on the other hand, is similar to a calculated column. However, they do not occupy any physical memory and their results cannot be seen in the form of a column. We usually use this when we want to perform dynamic computations on a group of rows or by grouping data together
DAX Formula – Syntax
Before you create your own formulas, let’s take a look at DAX formula syntax. Syntax includes the various elements that make up a formula, or more simply, how the formula is written. For example, here’s a simple DAX formula for a measure:
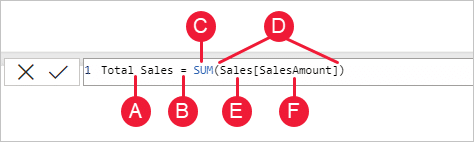
This formula includes the following syntax elements:
A. The measure name, Total Sales.
B. The equals sign operator (=), which indicates the beginning of the formula. When calculated, it will return a result.
C. The DAX function SUM, which adds up all of the numbers in the Sales[SalesAmount] column. You’ll learn more about functions later.
D. Parenthesis (), which surround an expression that contains one or more arguments. Most functions require at least one argument. An argument passes a value to a function.
E. The referenced table, Sales.
F. The referenced column, [SalesAmount], in the Sales table. With this argument, the SUM function knows on which column to aggregate a SUM.
When trying to understand a DAX formula, it’s often helpful to break down each of the elements into a language you think and speak every day. For example, you can read this formula as:
For the measure named Total Sales, calculate (=) the SUM of values in the [SalesAmount ] column in the Sales table.
Most useful DAX functions in Power BI
Important DAX functions in power BI
A DAX function is a predefined formula which performs calculations on values provided to it in arguments. The arguments in a function need to be in a particular order and can be a column reference, numbers, text, constants, another formula or function, or a logical value such as TRUE or FALSE. Every function performs a particular operation on the values enclosed in an argument. You can use more than one argument in a DAX formula.
Now let’s take a rundown at the commonly used DAX functions in Power BI that help you generate better reports. Let’s get started….
#1- Calculate()
It is one of the most important functions that help you evaluate the expressions by adding your own filters to data.
Syntax- CALCULATE(<expression>, <filter1>, <filter2>…)
Example-
Sum of sales all countries = CALCULATE(SUM(‘Sales'[Sales]),ALL(‘SalesGeography’))
The column that you want to aggregate is represented by the first parameter, whereas the 2nd filter represents a boolean that removes all the filters. This specific function is mostly used with aggregation functions. Moreover, this powerful function acts as a supercharged “IF” statement and provides real insight into your data.
#2- Filter()
The working of the Filter function is the same as the Calculate function. The major difference between the two is that Filter functions are not mutable and are commonly used to return a subset of expression or table.
Syntax- FILTER(<table>,<filter>)
Example-
Count of sales orders over 200 = COUNTROWS(FILTER(‘Sales’, ‘Sales'[Sales] > 200))
The identification of the expression resulting in a table is represented by the first parameter, whereas the 2nd parameter represents a true/false or boolean expression assessed from each row of the table. If you are thinking of using it as a standalone function, then you might not be able to get the result because this function is used with other functions.
You may Also like:
Reasons to Choose Power BI over Excel?
What is Power BI Deployment Pipeline?
3 Important Power BI Features That Can Benefit Your Business
What is the Best Option for Data Analytics Training?
#3- ALL function()
All function is another useful top DAX functions of Power BI that you should know about. It is basically used to get all the rows and columns in a table irrespective of the applied filters. If you want to calculate the aggregations, then All functions will help you get an accurate value.
Syntax: ALL(<table> or <column>)
Example-
Count of grand total sales= COUNTROWS(ALL(‘Sales’))
In this example, ALL functions are applied to the sales table by clearing all the filters that you might have applied earlier. This function plays a great role, especially if you want to calculate denominators for calculating ratios and percentages. Similar to the Filter function, ALL function is used in conjunction and allows you to get a count of grand total sales.
#4- Related()
Related is categorized under table function that is applied to the conditions and operations on the entire table. With this function, you can easily return the related value from another table by using the below-mentioned syntax.
Syntax- RELATED(<column>)
Example-
Count of sales in the America = COUNTROWS(FILTER(ALL(‘Sales’), RELATED(‘SalesGeography'[Countries]) = “America”))
In this example, the count of sales for America is retrieved from one table to another by establishing a relationship. This particular expression is executed in a row context and helps you retain the relationships between columns of that table. Whenever this function is performed, all the values in the specified table are examined regardless of any filters.
#5- Min ()
By using the Min() function, you can get the smallest value in a column within a blink of an eye. Also, you can get the smallest value between two scalar expressions accurately. Texts, numbers, blanks, and dates are some types of values that are counted in Min function. If you use a blank, then it will be considered as zero(0).
Syntax- MIN (Column Name) or MIN (expression1, Expression2)
Example- MIN([SalesMargin])
The example added above will get you the smallest value from the added column of SalesMargin. Say, if you want to get the result of two scalar expressions, then use two values in this function like- Min([TotalSales], [ResellerMargin]). In this example, you will get the minimum values from the column TotalSales and ResellerMargin.
#6- Max()
If you want to extract the maximum value from the column or between two scalar expressions, then the Max() function can help you in the same. Basically, it is totally opposite to the Min() function. It returns the maximum value of your added expression.
Syntax– MAX(<column>) or MAX(<expression1>, <expression2>)
Example– MAX(OnlineSales[ProfitAmount])
The example added above returns the maximum value found in the ProfitAmount column of the OnlineSales. You don’t have to spend hours to get the maximum value. By applying a single function, you will receive an accurate value.
Say if you want to get the maximum value of two expressions, then use the function like- Max([TotalSales], [ResellerMargin]). This example will get you the maximum values of TotalSales and ResellerMargin. Always remember that if you use a blank value in the expression, then it will be treated at Zero(0).
#7- Average()
Are you spending hours on finding the average (arithmetic mean) of all the numbers in a column? If yes, then this function is for you. It allows you to get an average value of all the numbers. While adding non-numeric values like text, remember that no aggregation will be performed, and it returns blank. Also, while adding logical values or empty values, the function will not be performed because all such values are ignored, but if your cell includes zero value, then it will be counted.
Syntax- AVERAGE (Column Name)
Example- AVERAGE(OnlineSales[ProfitAmount])
The example added above will get you the average values in the column, ProfitAmount, in the table, OnlineSales. In this function, if there are no rows, then it will return a blank value. Talking about MS- Excel, then also it returns zero(0) value if the rows do not meet the conditions. So, always keep such things in mind while using top DAX functions in Power BI.
Useful reading- 5 POWER BI ALTERNATIVES
#8 – LOOKUP( )
The LOOKUP function is pretty similar to Vlookup in Microsoft Excel.
The third table in our dataset contains the details of all the managers per region. Now here is where LOOKUP comes in hand. We can perform a lookup for the ‘Manager’ column in the ‘users’ table against the corresponding ‘Region’ column in the ‘orders’ table.
So how do we perform a lookup in Power BI? There are two things we need to remember:
We need a common column in order to perform a lookup
We also need unique values in at least one of the matching columns chosen from two different tables. The basic syntax for lookup is:
LOOKUPVALUE(Result Column Name, Search Column Name, Search Column value)
Putting this syntax using our dataset variables:
Manager = LOOKUPVALUE(Users[Manager],Users[Region],Orders[Region])
Nested IF Condition
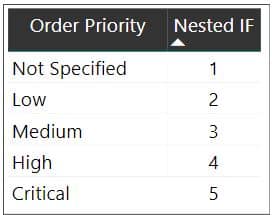
Consider the orders table in our dataset. The ‘Order Priority’ column has five values under it. Let’s assume we need some integer values instead of the original values present in that column. The Nested IF statement is our friend here:
Nested IF = IF(Orders[Order Priority] =”Critical”, 5, IF(Orders[Order Priority] =”High”, 4, IF(Orders[Order Priority] = “Medium”, 3, IF(Orders[Order Priority] = “Low”, 2, IF(Orders[Order Priority] = “Not Specified”, 1)))))
Conditional Formatting
Conditional formatting is one of the most commonly used features of Microsoft Excel. And we can leverage that inside Power BI as well!
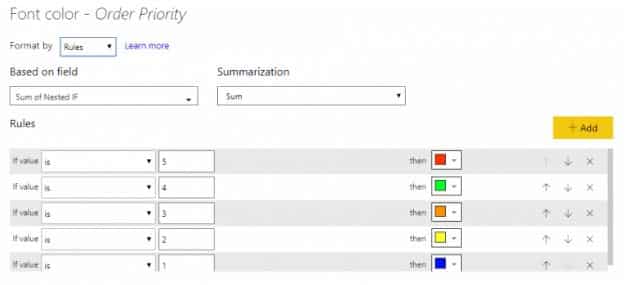
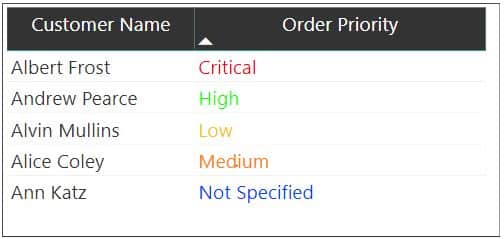
Conditional formatting, for those who haven’t used it before, is the ability to change the font color of a column based on a condition from another column. This can be done by creating a new column as per our condition and then using that column to set rules in the conditional formatting tab.
Ex: We want to change the color of the values displayed in the ‘Order priority’ column of the orders table. For example, all ‘Critical’ values should be in red color, all ‘High’ values should be in green color, etc.
We can use the Nested IF column we created above since the conditions are already specified. Set rules in the conditional formatting tab – if the value of the column created above is 1, then the font color should be red If the value is 2, then it should orange, and so on.
Splitting a String Based on Delimiters
Another common Excel function we can use in Power BI:
customer_split_1 = PATHITEM(SUBSTITUTE(Orders[Customer Name],” “,”|”),1)
The above PATHITEM function returns the resulting string. The SUBSTITUTE function replaces the delimiter specified with a particular character and fetches the corresponding word based on the value mentioned.
Fetching a Particular Letter from a Word
What if we wanted to extract only a particular letter from a word? It sounds tricky, but it’s actually quite easy in Power BI:
customer_initial_1 = LEFT(Orders[customer_split_1],1)
We did it in just one line of code!
Let’s say a particular customer’s name is “Helen Stein” and the split is divided into two parts. We use the above DAX to get the first letter from the first split word (Helen). The LEFT function returns the number of characters by positioning to the start of the string. If we give 2 instead of 1, the above DAX will return “He” instead of “H”.
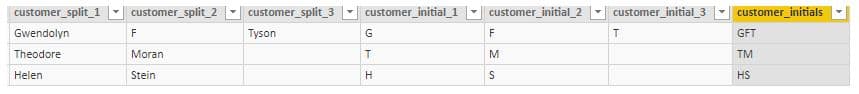
Concatenating Strings
We often find ourselves in situations where we need to combine two words together. To see how this works in Power BI, let’s assume we have multiple initials in our data.
We need to specify only the customer initials in the visualization rather than their whole name. This will help keep the table neat and compact:
customer_initials = CONCATENATE(Orders[customer_initial_1],CONCATENATE(Orders[customer_initial_2],Orders[customer_initial_3]))
The concatenate function joins strings together. Here, we have performed a concatenation of three columns:
WEEKDAY()
The WEEKDAY function returns an integer number giving us the current day. Let’s figure out the day when a few orders were dispatched:
weekday = WEEKDAY(Orders[Ship Date],2)
The integer number displayed above specifies the start day:
1 – Start from Sunday = 1 and ends on Saturday = 7
2 – Start from Monday = 1 and ends on Sunday = 7
3 – Start from Monday = 0 and ends on Sunday = 6
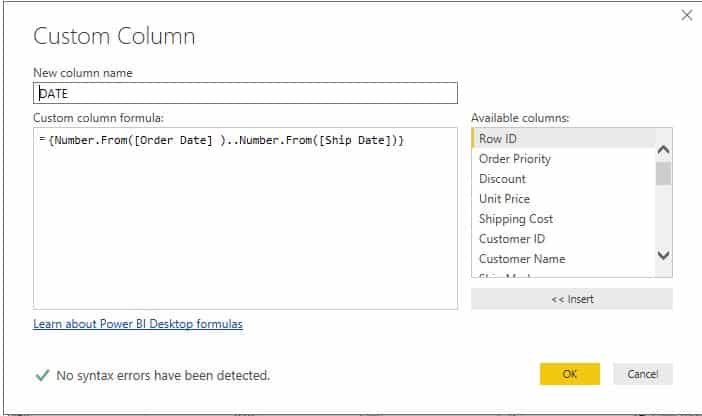
DATE Split Up
There are times when we need to un-pivot the date for certain projects. Here’s the good news – we can do this with the help of DAX and the query editor in Power BI.
Now, we have two columns – order date and shipping date. We want to delist the dates lying between the two intervals. Let’s take the order date as 01-01-2015 and the shipping date as 03-01-2015. Since there’s a 3-day difference between them, this row will be listed three times.
We can do this through the query editor in Power BI. Select the ‘Custom Column’ option in the ‘Add Column’ Tab. The below window pops up and we can add a column name and use the DAX query:
= {Number. From ([order Date] )..Number. From ([Ship Date])}
Types of DAX functions
Hera are most used DAX functions in Power BI reference provides detailed information including syntax, parameters, return values, and examples for each of the over 250 functions used in Data Analysis Expression (DAX) formulas.
1. Date and time functions
These functions help you create calculations based on dates and time. Many of the functions in DAX are similar to the Excel date and time functions. However, most important DAX functions use a datetime data type, and can take values from a column as an argument.
Function Description
CALENDAR Returns a table with a single column named “Date” that contains a contiguous set of dates.
CALENDARAUTO Returns a table with a single column named “Date” that contains a contiguous set of dates.
DATE Returns the specified date in datetime format.
DATEDIFF Returns the number of interval boundaries between two dates.
DATEVALUE Converts a date in the form of text to a date in datetime format.
DAY Returns the day of the month, a number from 1 to 31.
EDATE Returns the date that is the indicated number of months before or after the start date.
EOMONTH Returns the date in datetime format of the last day of the month, before or after a specified number of months.
HOUR Returns the hour as a number from 0 (12:00 A.M.) to 23 (11:00 P.M.).
MINUTE Returns the minute as a number from 0 to 59, given a date and time value.
MONTH Returns the month as a number from 1 (January) to 12 (December).
NETWORKDAYS Returns the number of whole workdays between two dates.
NOW Returns the current date and time in datetime format.
QUARTER Returns the quarter as a number from 1 to 4.
SECOND Returns the seconds of a time value, as a number from 0 to 59.
TIME Converts hours, minutes, and seconds given as numbers to a time in datetime format.
TIMEVALUE Converts a time in text format to a time in datetime format.
TODAY Returns the current date.
UTCNOW Returns the current UTC date and time
UTCTODAY Returns the current UTC date.
WEEKDAY Returns a number from 1 to 7 identifying the day of the week of a date.
WEEKNUM Returns the week number for the given date and year according to the return_type value.
YEAR Returns the year of a date as a four digit integer in the range 1900-9999.
YEARFRAC Calculates the fraction of the year represented by the number of whole days between two dates.
2. Filter functions
The filter and value functions in DAX are some of the most complex and powerful, and differ greatly from Excel functions. The lookup functions work by using tables and relationships, like a database. The filtering functions let you manipulate data context to create dynamic calculations.
Function Description
ALL Returns all the rows in a table, or all the values in a column, ignoring any filters that might have been applied.
ALLCROSSFILTERED Clear all filters which are applied to a table.
ALLEXCEPT Removes all context filters in the table except filters that have been applied to the specified columns.
ALLNOBLANKROW From the parent table of a relationship, returns all rows but the blank row, or all distinct values of a column but the blank row, and disregards any context filters that might exist.
ALLSELECTED Removes context filters from columns and rows in the current query, while retaining all other context filters or explicit filters.
CALCULATE Evaluates an expression in a modified filter context.
CALCULATETABLE Evaluates a table expression in a modified filter context.
EARLIER Returns the current value of the specified column in an outer evaluation pass of the mentioned column.
EARLIEST Returns the current value of the specified column in an outer evaluation pass of the specified column.
FILTER Returns a table that represents a subset of another table or expression.
INDEX Returns a row at an absolute position, specified by the position parameter, within the specified partition, sorted by the specified order or on the specified axis.
KEEPFILTERS Modifies how filters are applied while evaluating a CALCULATE or CALCULATETABLE function.
LOOKUPVALUE Returns the value for the row that meets all criteria specified by search conditions. The function can apply one or more search conditions.
OFFSET Returns a single row that is positioned either before or after the current row within the same table, by a given offset.
ORDERBY Defines the columns that determine the sort order within each of a WINDOW function’s partitions.
PARTITIONBY Defines the columns that are used to partition a WINDOW function’s <relation> parameter.
REMOVEFILTERS Clears filters from the specified tables or columns.
SELECTEDVALUE Returns the value when the context for columnName has been filtered down to one distinct value only. Otherwise returns alternateResult.
WINDOW Returns multiple rows which are positioned within the given interval.
3. Time Intelligence Functions
The time-intelligence functions are used to evaluate values over a fixed period such as days, weeks, months, quarter, years, etc. You can specify a time period using these functions and compare two scenarios in your report.
- CLOSINGBALANCEMONTH
- CLOSINGBALANCEQUARTER
- CLOSINGBALANCEYEAR
- DATEADD
- DATESBETWEEN
- DATESINPERIOD
- DATESMTD
- DATESQTD
- DATESYTD
- ENDOFMONTH
- ENDOFQUARTER
- ENDOFYEAR
- FIRSTDATE
- FIRSTNONBLANK
- LASTDATE
- NEXTQUARTER
- LASTNONBLANK
- NEXTDAY
- NEXTMONTH
4. Information Functions
The information functions are used to provide certain information on the data values contained in rows and columns. It evaluates the given condition in a function for the value given and return TRUE or FALSE. For instance, the function ISERROR will return TRUE if the value evaluated contains an error.
- CONTAINS
- CUSTOMDATA
- IN Operator / CONTAINSROW function
- ISBLANK
- ISERROR
- ISEVEN
- ISINSCOPE
- ISLOGICAL
- ISNONTEXT
- ISNUMBER
- ISODD
- ISONORAFTER
- ISTEXT
- LOOKUPVALUE
- USERNAME
5. Logical Functions
The logical functions are used to evaluate an expression or argument logically and return TRUE or FALSE if the condition is met or not.
- AND
- FALSE
- IF
- IFERROR
- IN
- NOT
- OR
- SWITCH
- TRUE
6. Mathematical and Trigonometric Functions
The mathematical and trig functions are used to perform all sorts of mathematical functions on the referred values. Given below, is a list of all the available math and trig are most useful DAX functions in Power BI.
- ABS
- ACOS
- ACOSH
- ASIN
- ASINH
- ATAN
- ATANH
- CEILING
- COMBIN
- COMBINA
- COS
- COSH
- CURRENCY
- DEGREES
- DIVIDE
- EVEN
- EXP
- FACT
- FLOOR
7. Statistical Functions
These functions carry out statistical and aggregation functions on data values in a DAX expression in Power BI. The list of available statistical functions is given below.
- ADDCOLUMNS
- APPROXIMATEDISTINCTCOUNT
- AVERAGE
- AVERAGEA
- AVERAGEX
- DIST
- INV
- INV
- INV.RT
- NORM
- T
- COUNT
- COUNTA
- COUNTAX
- COUNTBLANK
- COUNTROWS
- COUNTX
- CROSSJOIN
- DISTINCTCOUNT
- DIST
- GENERATE
- GENERATEALL
- GEOMEAN
- GEOMEANX
- MAX
- MAXA
- MAXX
- MEDIAN
- MEDIANX
- MIN
- MINA
- MINX
8. Text Functions
The text functions in Power BI are very similar to the string functions of Excel. These functions evaluate string values.
- BLANK
- CODE
- COMBINEVALUES
- CONCATENATE
- CONCATENATEX
- EXACT
- FIND
- FIXED
- FORMAT
- LEFT
- LEN
- LOWER
- MID
- REPLACE
- REPT
- RIGHT
- SEARCH
- SUBSTITUTE
- TRIM
- UNICHAR
- UPPER
- VALUE
9. Parent-Child functions
The parent and child functions are used for data values that are a part of a parent-child hierarchy.
- PATH
- PATHCONTAINS
- PATHITEM
- PATHITEMREVERSE
- PATHLENGTH
10. Table functions
The table DAX formulas for Power BI are used to apply operations and conditions on entire tables. The output of table functions is used as inputs in other expressions or arguments in a DAX formula. The results of these functions retain the relationships between columns of that table.
- FILTER
- ALL
- VALUES
- DISTINCT
- RELATEDTABLE
11. Other functions
There a bunch of functions that do not fit in any particular category. These are also very useful functions.
- DATATABLE
- ERROR
- EXCEPT
- GENERATESERIES
- GROUPBY
- INTERSECT
- ISEMPTY
- ISSELECTEDMEASURE
- NATURALINNERJOIN
- NATURALLEFTOUTERJOIN
- SELECTEDSMEASURE
- SELECTEDMEASUREFORMATSTRING
- SELECTEDSMEASURENAME
- SUMMARIZECOLUMNS
- Table Constructor
- TREATAS
- UNION
- VAR
New DAX functions
|
Function |
Month |
Description |
|
INDEX |
December, 2022 |
Returns a row at an absolute position, specified by the position parameter, within the specified partition, sorted by the specified order or on the specified axis. |
|
OFFSET |
December, 2022 |
Returns a single row that is positioned either before or after the current row within the same table, by a given offset. |
|
ORDERBY |
December, 2022 |
Defines the columns that determine the sort order within each of a WINDOW function’s partitions. |
|
PARTITIONBY |
December, 2022 |
Defines the columns that are used to partition a WINDOW function’s <relation> parameter. |
|
WINDOW |
December, 2022 |
Returns multiple rows which are positioned within the given interval. |
|
EVALUATEANDLOG |
November, 2022 |
Returns the value of the first argument and logs it in a DAX Evaluation Log profiler event. |
|
TOCSV |
November, 2022 |
Returns a table as a string in CSV format. This function applies to Power BI Desktop only. |
|
TOJSON |
November, 2022 |
Returns a table as a string in JSON format. This function applies to Power BI Desktop only. |
|
NETWORKDAYS |
July, 2022 |
Returns the number of whole workdays between two dates. |
You should also check out the Official Microsoft DAX function reference – a great resource!
In a Crux
The list of of most common DAX functions in Power BI is quite big. But all the functions that are added above are commonly used and help you make advanced reports and analyze the data without spending extra time and effort.
Hopefully, the points mentioned above help you get a clear understanding of DAX formulas. Hopefully it also makes clear how Power BI differs from Excel. Such functions allow you to get full control of your organizational data and perform the task with full accuracy and professionalism.
Still, if you have any doubts or want to share something about most commonly used DAX functions in power bi, feel free to drop a message in the comments section added below.
FAQs:
What are most important DAX functions in power bi?
DAX is a collection of functions, operators, and constants that can be used in a formula, or expression, to calculate and return one or more values. Stated more simply, DAX helps you create new information from data already in your model.
What are different DAX functions?
The DAX language uses four different types of calculation operators in formulas: Comparison operators to compare values and return a logical TRUE\FALSE value. Arithmetic operators to perform arithmetic calculations that return numeric values.
Where are DAX functions used in power bi?
DAX formulas are entered into the formula bar just below the ribbon in Power BI. Start by giving the formula a name and then follow with the equal-to sign (“=”). Then write in your formula using functions, constants, or strings.
How many DAX functions are there?
The DAX function reference provides detailed information including syntax, parameters, return values, and examples for each of the over 250 functions used in Data Analysis Expression (DAX) formulas.
What is the benefit of DAX?
DAX has several uses, including helping creators filter out superfluous data and letting them get straight to the data that matters most for their purposes.
What are DAX formulas?
DAX is a formula language for creating custom calculations in Power PivotTables. You can use the DAX functions that are designed to work with relational data and perform dynamic aggregation in DAX formulas. DAX formulas are very similar to Excel formulas.
What are the most common DAX functions used in Power BI?
DAX Functions for Power BI: Statistical Functions
- CONFIDENCE. NORM.
- COUNT.
- COUNTBLANK.
- COUNTROWS.
- CROSSJOIN.
- DISTINCTCOUNT.
- EXPON. DIST.
- GENERATE.
(The post was updated on 24 Dec 2022)
Related Posts

Building an AI-Ready Data Strategy: What Every Enterprise Should Get Right Before Scaling Artificial Intelligence
July 16, 2026Enterprise AI initiatives rarely stall because teams lack access to capable models. ...

What Social Media Analytics Actually Tell You – and What They Don’t
July 13, 2026If you work in data, you have probably watched a marketing team ...

Best 7 Revenue Intelligence Solutions for Technical Sales Teams
June 26, 2026Technical sales teams operate in a fundamentally different environment than most B2B ...

Primary Considerations for Building Resilience in Your Disaster Recovery Plan
June 15, 2026Without a solid disaster plan, system failures can plunge operations into the ...

5 Best Social Intelligence Tools for 2026
June 15, 2026Social intelligence has become one of the most important capabilities for brands ...