Why Business Professionals Are Choosing To Acquire Qlik Sense Certification
With each passing day, it seems like there are more tools available for companies to choose from for improving their business. Certain structural pillars like word processors and e-commerce solutions remain staples, but businesses also want training in other areas. This is where data visualization and Qlik Sense certification come into the picture.
Why Data Visualization Matters
Humans are primarily visual creatures. Between regular eyesight and visual imagination (among people who have either or both), visuals are a core component of human capabilities.
The problem is that data is often hard to understand and interpret if you’re looking at the raw data. Depending on how information is stored, it may not even be anything a human can rationally understand by trying to read it.
Data visualization is a practical way to turn an amorphous mass of numbers and references into something meaningful and valuable for a company.
Big Data and Bigger Data
Businesses love big data. With a sufficiently large data set, you can make startlingly accurate predictions about customer behavior, find trends as soon as they start, and learn to adjust business practices to maximize profits.
However, even the largest data set is only as valuable as your ability to ask questions and get meaningful answers. Data you can’t use is worthless. Data visualization is a core aspect of systems that can interact with data and piece it together to get a meaningful result.
Types of Visualization
Data visualization comes in many forms, but the primary thing to understand now is those different ways of visualizing data help make it more intuitive to understand and apply that data in a way that profits the business. For example, visualization can help show the impact of weather on profits or the areas where the most valuable customers are.
Visualization is about simplifying data and compressing it into a helpful form. If data itself is coal, then visualization is a diamond, much more valuable, highly refined, and, in many ways, more practical for companies to use.
For example, waterfall charts are an excellent way to show how different areas add or subtract from a final result. Most financial things function as part of a whole, so displaying data this way is more accurate than just having numbers on a spreadsheet.
Employee Interaction
Outside of visualization itself, businesses also have to consider employee interaction with the software.
For example, how easy is it for employees to configure data displays and get results? Does software show everything an employee may need to discuss or is the software falling short there? How well does the software interface with anything else employees are using?
There’s more to data visualization than just picking software that sounds good. Businesses must analyze their options from multiple angles and talk to employees in different departments to get the most value from systems.
Why Companies Care
Companies care about data visualization because it’s an extremely crucial element of decision-making. Rather than making guesses, companies prefer to back their decisions with data and information.
The result is that employees who are good at managing and displaying data gain more value. They can often produce better results with the same amount of work, which is ideal from any company’s financial perspective.
What Is Qlik Sense?
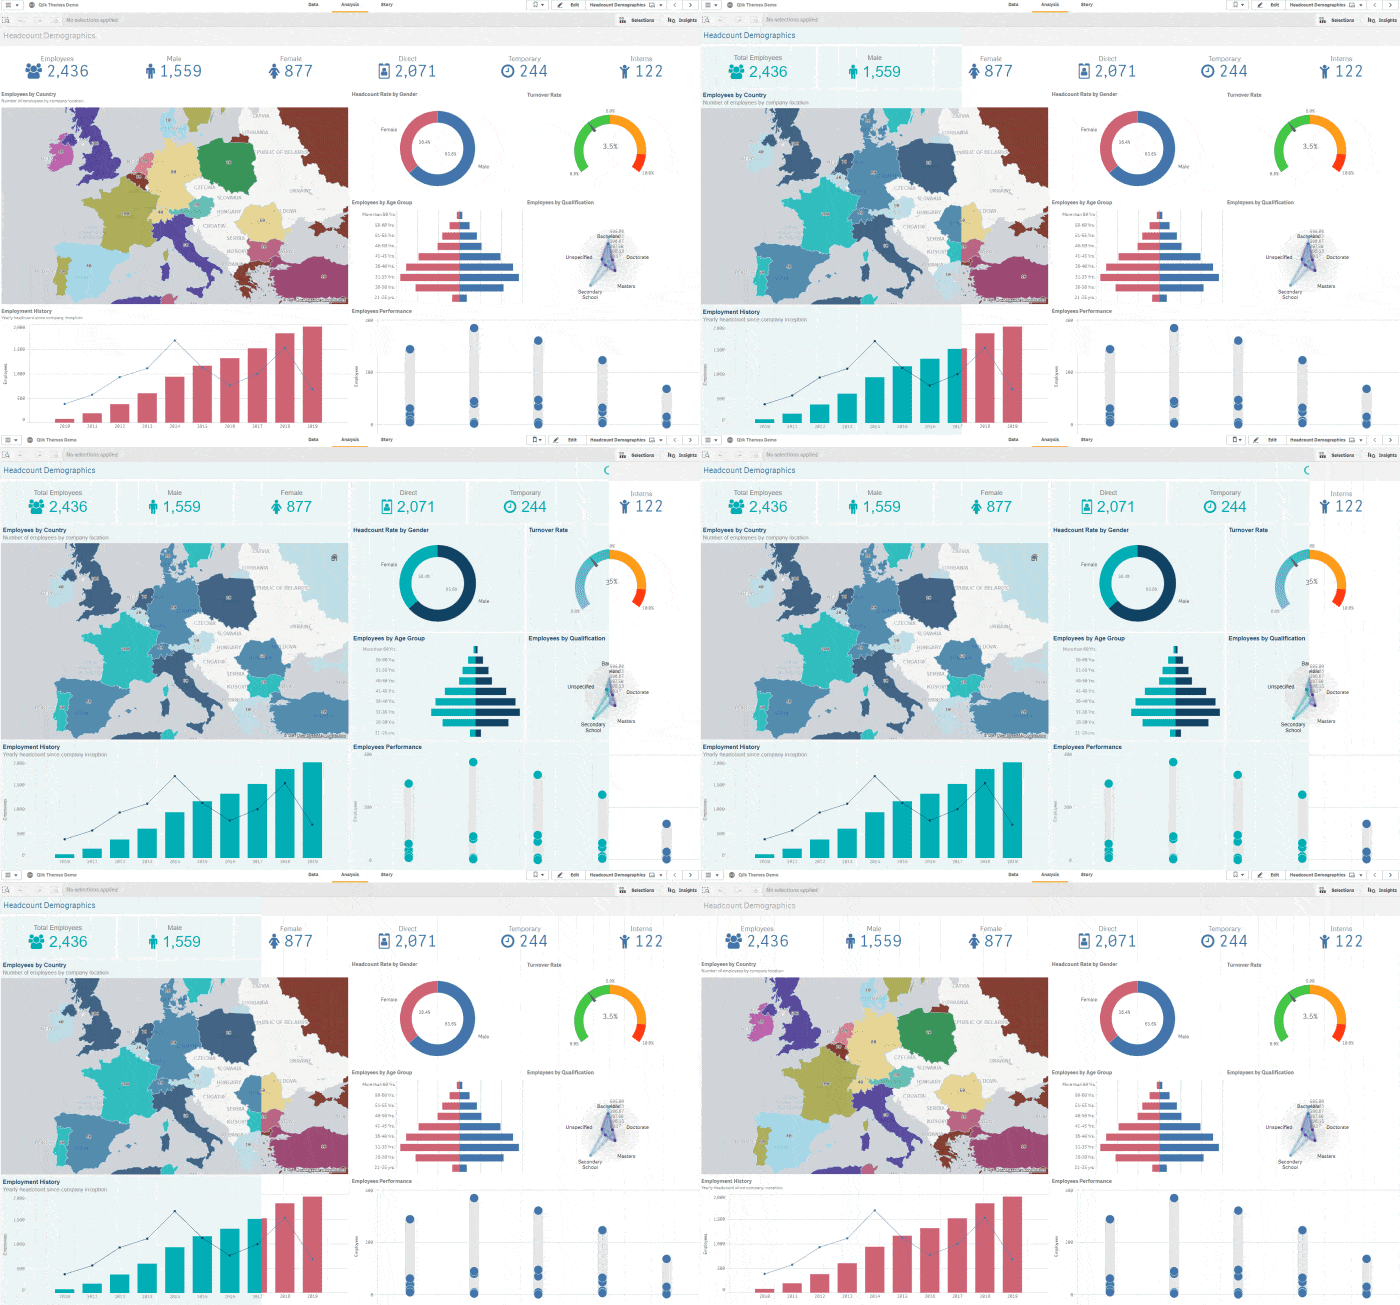
Qlik Sense is a modern cloud analytics suite designed for employees at all levels of an organization. Several of its features set it apart from other analytics software, thereby encouraging professionals to acquire certification in using it.
Self-service Visualizing
Qlik Sense offers a self-service visualization system, which allows employees to combine, load, and explore data in different ways. The system supports asking questions and trying to find answers and with the ability to interact with any chart or table and get more information about a topic.
What this comes down to is context. Information in a vacuum has limited value for any business, regardless of how hard you try to be creative. The most valuable data tends to explain how, when, and why something occurred.
For example, when visualizing data in Qlik Sense, business professionals may see that 90% of their revenue is coming from 10% of their customers. By following this data, they may see that of these valuable customers, most of them are making orders in the last week of a month.
By exploring even further, the company could find that most of the valuable customers are government agencies purchasing supplies. By seeing what those agencies are doing and what they need, the business can add products that are even more appealing, encouraging those companies to either buy more or at least stick to that business as a supplier.
Examples like this show why following data leads to real value for businesses. Knowing that some customers pay more than others isn’t surprising, it’s ordinary. Knowing who those customers are, why they’re purchasing, and driving more interest is what truly helps.
AI Analysis
AI is controversial, to say the least. From artists to banks, AI is shaping the way people work and play. With the Qlik Sense extension, AI is working to improve results in ways that make sense to business professionals. After all, it’s hard to get an answer if you don’t know what question to ask.
Qlik Sense can leverage what it learns from tens of thousands of customers to help understand what people are likely to want at any given time. With its natural language integration, it can minimize cognitive bias and avoid getting people trapped in a mirrored hallway of assumptions.
Hold on, now. Notice something about that description? Qlik Sense is using data to understand its users, which is the same thing businesses are doing to understand their customers. The users are on both sides of the experience, and that’s good because it makes a better product.
Automating Processes
Qlik Sense helps automate some basic processes for visualizing data, especially when it’s using predictive systems.
Here’s a question to consider: How many tasks are genuinely complex? Before you answer, there’s something to consider about all of this: most things that we think of as complex are essentially a series of simple tasks done in a specific order.
If there’s anything technology is good at, it’s repeating a predetermined process. This is where software like Qlik Sense shows its real value for users and businesses. The more it can simplify and predict what people want, the less time it takes to use and the better the results will be.
Real-time Analytics
Evaluating things after some time isn’t always bad. After all, you can’t know the exact performance of a marketing campaign until after it’s done.
However, in the modern world, active analysis is even more valuable. By using data, companies can make good estimates as to how a user is feeling and what might encourage them to act in certain ways. With the right contact setup, this can significantly improve sales.
As an example, let’s say that a company determines anyone who stays on a checkout page longer than 30 seconds may be ready to abandon their cart. Considering about 70% of online carts are abandoned, that’s not a minor concern for any business.
Businesses remedy this problem by adding prompts or extra offers for anyone who gets close to the limit. Giving people free shipping or offering an extra discount can help bring them back.
However, data might also suggest that surprise costs, such as taxes and fees, are to blame for people abandoning their carts. Qlik Sense can help reveal that and reduce the number of people who leave without making a purchase.
Markets move in real-time, as do people. Software that can track problems and report them as they occur is fundamentally more powerful, and therefore more valuable. Consumers want to get the most bang for their buck, so software that can do many things at once makes more sense to become certified for.
Accessibility
One component of data visualization that’s not as obvious is its accessibility. Some systems only work on specific computers that are directly attached to servers housing company databases.
Other services, like Qlik Sense, operate in the cloud and offer workers easy access to data from practically any device. This is faster, easier, and better for most companies. Since calculations are done remotely, users can expect consistent speed and performance no matter where they are or what else they’re doing.
Compatibility
Finally, Qlik Sense excels at integration compared to its competitors. We’ve already discussed how data isn’t valuable if you have no way to interpret it, but a visualization system with no access to your information is just as worthless.
Qlik Sense connects with hundreds of potential data sources such as:
- Numerous Amazon systems
- Facebook Insights
- GitHub
- DropBox
- Microsoft
- Cisco
- Slack
- And more
Its touch-based interface makes it easy to use the solution on any device, making it a potent tool that every business should leverage.
Final Thoughts
Business professionals are choosing Qlik Sense because it works. More than anything else, that’s the driver of decision-making at companies. Qlik Sense is powerful, easy to use, integrates with most data sources, and provides usable results. In short, it gets the job done.
Any business professional who chooses to ignore Qlik Sense certification is gimping themselves.


