3 useful tools for big data log analysis
 When looking around the data center, it’s difficult to ignore the potential in all of the big data available from infrastructure systems. There are server and application logs, data from network and storage taps, and metadata from databases and applications. In addition to the server and storage infrastructure, there’s data from network devices, which include security device logs and router and switch data.
In theory, all of this data could be used to identify trends to predict or even prevent service outages. At the very minimum, this data could be used to correlate events and identify sources of application issues. I’ll look at three products that take different approaches to infrastructure data analysis.
Splunk
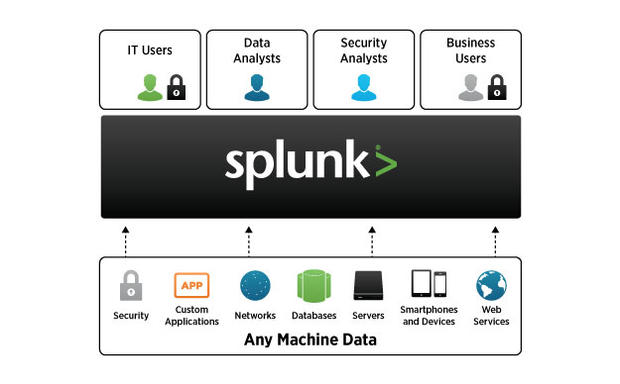
Splunk is a long-time industry player in infrastructure data analysis. It has traditionally been considered a log collector or aggregation tool, but it has matured into a pseudo big data analysis tool. Splunk has expanded its use cases to include analysis of all kinds of data, including baseball analytics. When it comes to infrastructure data, Splunk aggregates and nom data for diverse sources.
Since Splunk is looking to diversify beyond an infrastructure management tool, Splunk doesn’t limit the data sources to traditional data center devices. Splunk allows data collection from the Internet of Thing (IoT) devices and sensors. An example analysis could be a correlation of temperatures from rack-integrated thermostats and web server requests. The findings may result in making changes to a load balancer in order to optimize data center cooling.
Splunk allows for the use of a wizard to create simple but powerful data analysis. For advanced users, Splunk leverages its Search Processing Language (SPL) to create deeper and much more advanced data correlation.
Splunk is available in two editions: Free and Enterprise. With the Free version, the data set limit is 500 GB; it must be used in a non-commercial environment; and it places limits on the available features.
VMware vRealize Log Insight
The name change from vCenter Log Insight to vRealize Log Insight was long overdue for VMware’s analysis tool. vRealize Log Insight extends well beyond your virtual environment; with most applications in the category, it can collect a large variety of data.
A lot of VMware’s value is in making complex technologies simple for wide adoption, and vRealize Log Insight follows this design philosophy by leveraging wizards and GUIs to create queries. In addition to the overall ease of use, vRealize Log Insight provides a developer’s guide to provide richer capability; plus, it integrates directly with vCenter.
If you’re heavily invested in VMware’s virtualization platform, vRealize Log Insight has a strong leg up when you’re considering analysis tools.
Virtual Instruments
When dealing with the massive amounts of data associated with log collection and analysis, a major consideration is the resulting overhead on the infrastructure. Whether it’s a business application or an infrastructure tool, big data taxes the infrastructure. With any tool, an organization may consider dedicating resources to log collection and analysis. Virtual Instruments takes this design approach by providing an appliance to perform log collection and analysis.
Virtual Instruments provides the appliances needed to collect the data and its software analysis tool VirtualWisdom to visualize the data. Virtual Instruments leverages anonymized data from existing client data to help provide accelerators in the form of canned reports. These accelerators could be used to reduce the time required to garner useful information from machine data such as network tapes and application logs. Source
Related Posts

What Social Media Analytics Actually Tell You – and What They Don’t
July 13, 2026If you work in data, you have probably watched a marketing team ...

Best 7 Revenue Intelligence Solutions for Technical Sales Teams
June 26, 2026Technical sales teams operate in a fundamentally different environment than most B2B ...

Primary Considerations for Building Resilience in Your Disaster Recovery Plan
June 15, 2026Without a solid disaster plan, system failures can plunge operations into the ...

5 Best Social Intelligence Tools for 2026
June 15, 2026Social intelligence has become one of the most important capabilities for brands ...

The 2026 Data Observability Vendor Database: 20+ Platforms by Founding Year, Funding, Hosting, and Pricing
June 12, 2026The data observability market has evolved rapidly over the past five years. ...