Data Science –What’s the big deal about it?
Thomas Davenport, an American academic and publisher for Harvard Business Review, once said that Data Scientist is “the Sexiest Job of the 21st Century”. But why is there such a big hype and mythos about Data Scientists and Data Science?
The role of the Data Scientist came up with the Big Data area. But it’s not a quite new role in the enterprise business. Before we called them statisticians or subject matter experts. So what makes him now so different and what skills brings a Data Scientist to his role? Drew Conway published a very interesting illustration, called the “Data Science Venn Diagram”:
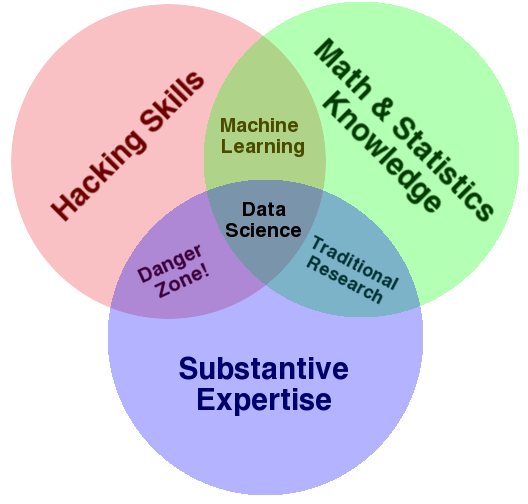 This diagram explains the 3 major skills a good Data Scientist must have. Interesting is the area where math & statistics knowledge is missing, which is called “Danger Zone!”. So to make it clear, a good programmer with a good substantive expertise in a certain area is not enough to become a good Data Scientist. According to DJ Patil, chief scientist at LinkedIn, the best data scientists tend to be “hard scientists,” particularly physicists, rather than computer science majors. Physicists have a strong mathematical background, computing skills, and come from a discipline in which survival depends on getting the most from the data. They have to think about the big picture, the big problem. But why are math & statistics knowledge so important?
A glance at history
As I already mentioned Data Science is a not a new discipline. A lot of people did advanced analytics, simulations, data mining, machine learning and prediction years ago. It was and is very common in the banking and insurance sector. So let’s have a quick glance at history.
Everything started with gambling. The first gambling came up already 3000 B.C. as dices of bones. In the 17th century humans started to look at gambling from a more scientific perspective. It was LaPlace and Fermat who discussed in several letters the Problem of Chevalier. These discussions are also called the birth of the probability theory.
The Science in Data Science
Statistics and Data Science is mostly about probability. Based on large amounts of data customers want to predict or estimate the probability of different numbers or events, like forecasts, risks, churn, etc. Other areas are calculation of analytical variance, machine learning or order complexity, all scientific methods applied on data. A good example how this can be use are weather forecasts, as you can see in the next picture:
The graph (white line) starts with the current day and shows a forecast for the next 15 days. The gray area around the white line is the variance of the temperature prediction, which is very small in the next 5 days (so the prediction is very accurate) but than starts to grow.
There are other kind of predictions where we can apply these methods like product sales prediction, dynamic pricing, predictive maintenance, customer churn, etc.
Summary
The reason why we see such a big interest in this area is, that other industries than banks and insurances want to leverage these skills and technologies on their data, like retail, Telco’s, manufacturer, airlines, etc. Years ago the software and technologies you needed to buy was quite expensive and people with this skillset quite rare. Now the market is demanding more people with this knowledge and the technological development brings more software providers and innovative platforms on the market, so that companies like SAS and IBM with SPSS, which have been the leaders for years, now recognize a higher competition. Competition is always good, because it pushed the market, the innovation and also prices.
Hopefully you got a more clearer view on this topic now. I will follow up on this with more post on how we can use these approaches on our data and what we can analyze with it. Source
Related Posts

Top Innovations for Environment-Friendly Dumpster Rental Businesses
April 18, 2024In a world that’s gradually waking up to the environmental perils of ...

How to Leverage AI for Content Creation and Scheduling
April 17, 2024Content creation is the heartbeat of digital marketing and creative endeavors. It ...

How to Increase Magento Site Speed
April 17, 2024The speed of your Magento webstore is a crucial factor for both ...

How Emerging AI Technologies Enhance Intrusion Detection Systems
April 16, 2024Nowadays, robust security practices that involve a layered approach are the backbone ...

Unveiling SEO Treasures: Identify Keywords Beyond Your Competitors’ Reach
April 16, 2024Introduction Ever wondered how search engines like Google decide which websites to show ...